Choose an Insurance Quote
The youth tax: A 20-year-old new driver could be paying over $13,000 for insurance a year
Jump to:
- Why do young drivers tend to be worse drivers?
- A young male driver pays over $3,000 more than a young female driver in insurance annually
- Inexperience affects drivers both young and old
Show more
- Drivers are getting licensed later in life
- Usage-based insurance rewards safe drivers with up to 30% in premium savings
- Despite modern distractions, the roads themselves are getting safer
- Distracted and dangerous driving are habits we need to break
- The kids really are alright – but their insurance rates aren’t

Managing editor

VP of Insurance & Chief Underwriting Officer
Older people like to blame the youth for society’s ailments, but there are a few instances where it’s sometimes justified.
Road safety might be one of them. According to data pulled from the Rates.ca auto insurance quoter, drivers under 25 – particularly males – are significantly more likely to be involved in dangerous driving incidents than all other age groups.
Generally — and unsurprisingly — when it comes to driving, the older and more experienced you are, the safer you are on the roads. For example, 0.35% of male drivers over the age of 60 years old reported receiving serious or major tickets in their driving history, while 0.62% of those age 45 to 59 did*.
The rate of major or serious infractions went incrementally up as age groups went down— 0.98% of drivers age 25 to 34 reported dangerous driving tickets, while 1.3% of male drivers age 25 and young had major or serious tickets on their records.
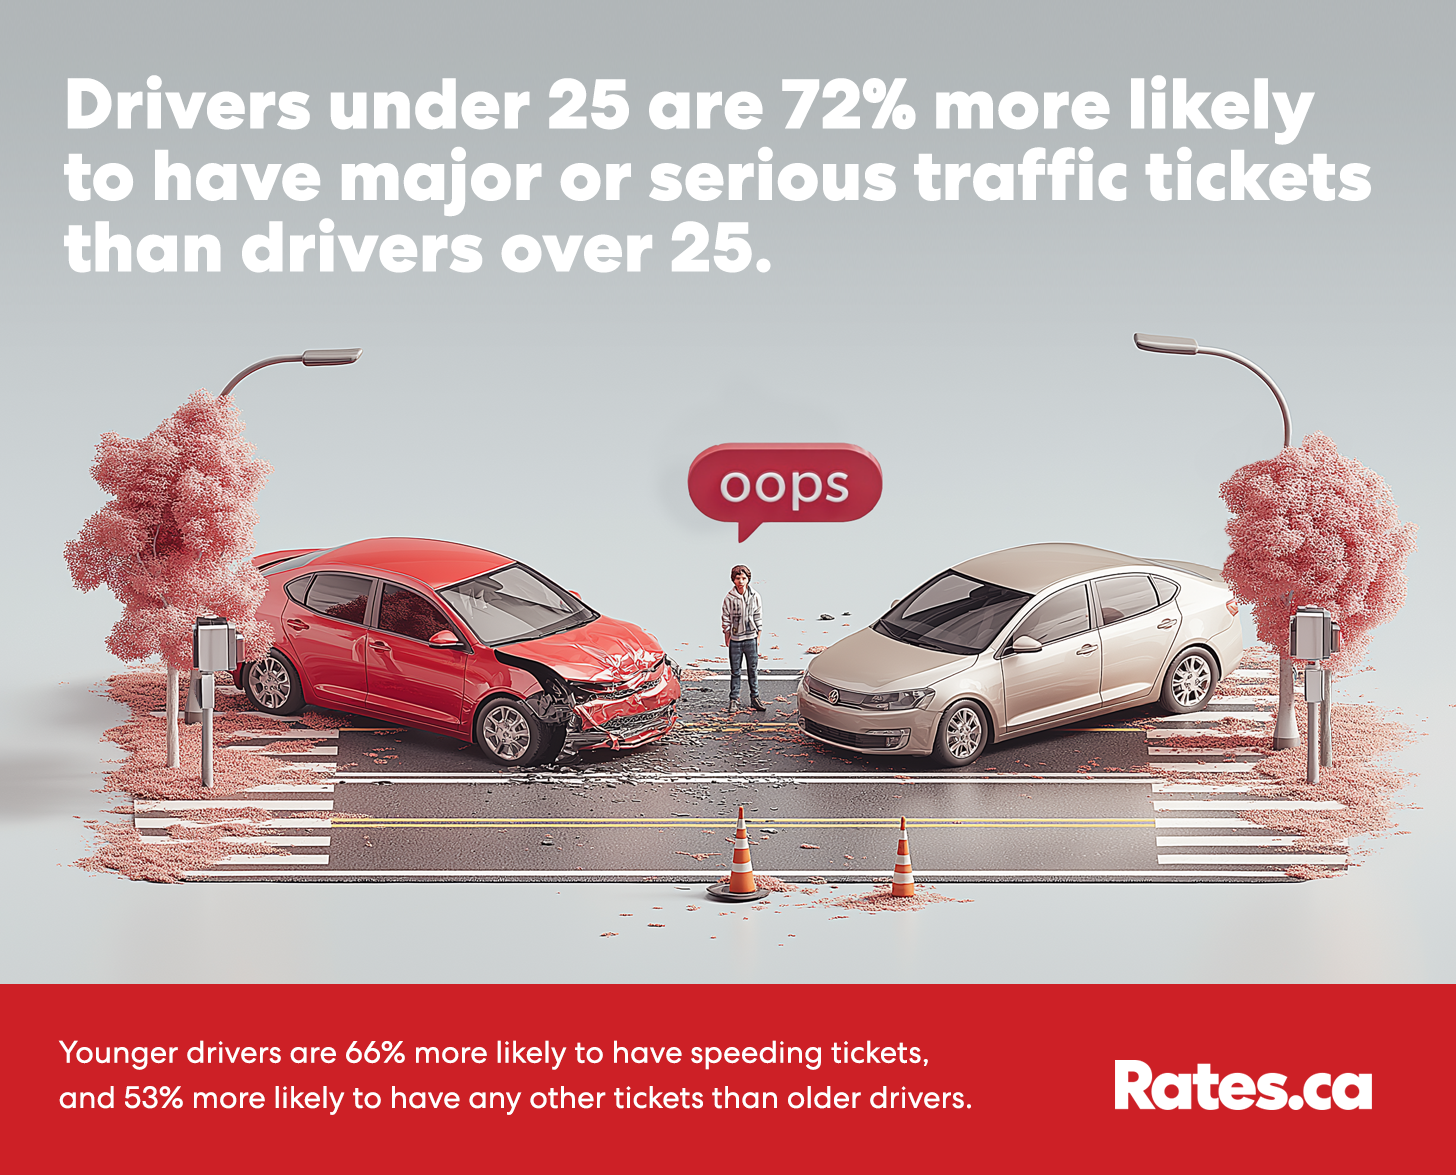
Put another way: Males under 25 years old are 73% more likely to have serious tickets on their records than older male drivers.
Meanwhile, female drivers under 25 were 53% more likely to have these serious tickets than older female drivers (overall, female risk levels were lower than their male counterparts).
It doesn’t just stop at major tickets. In general:
- Drivers under 25 are 66% more likely to have speeding tickets than drivers over 25.
- Drivers under 25 are 53% more likely to have any tickets than drivers over 25.
- Drivers under 25 are 17% more likely to have been in recorded accidents than drivers over 25 (however, this number is likely higher, as accidents are often settled outside of insurance).
Driving – is it another thing ruined by Gen Z?
Not quite. While young drivers tend to get in more scrapes more often, Canadian drivers overall appear to be driving more safely than in previous decades — and much more safely compared to our neighbours to the south.
Key trends:
- Your chances of getting major tickets lowers the older you are. 1.3% of male drivers age 25 and young had major or serious tickets on their records. This is 73% higher than the average of all older male drivers.
- Younger drivers are more susceptible to peer influences to engage in risky behaviour, speeding, fatigue, and improper seatbelt usage. As a result, a 25-year-old male driver with very little experience can expect to pay up to $13,418 per year for insurance.
- Inexperience is its own separate risk factor: New drivers of any age can easily misjudge road speeds and stopping distances.
- However, inexperience and high premiums can be helped with a licensed driver training course. The young driver quoted above can save roughly $2,000 on insurance just by completing a MTO-approved drivers training course.
- Anxiety and other factors may be leading drivers to get licensed later in life. The average student with Young Drivers of Canada is now 20 years old. Across Ontario, nearly 30% of all G1-holders are between 25 to 34.
- The roads are getting safer. In 2025, Canada experienced 28% fewer road fatalities since 2005. Compared to the U.S., where road deaths have grown with population, Canada has seen a marked decline due to stricter distracted driving and impaired driving laws, and automated speed enforcement (such as more speed cameras) as a reason behind the divergence.
Why do young drivers tend to be worse drivers?
To understand why young drivers have such high incident rates, just think back to high school, and your one friend with their own car (or maybe that’s you!). You’re driving home after school or from a party. The music is blasting, the windows are down, and your buddies are goofing off in the back seat.
From there, just count the distractions: Fiddling with the radio, shouting over the din, the jerks in the back — maybe one to a seatbelt, but maybe more. Maybe you were all up late at night studying for an exam; your exhaustion masked by energy drinks and the buzz of energy around you.
Who’s watching the speed limit? Who’s goading on the driver to push the speed limit?
“There are various biological, psychological, and developmental changes that occur in adolescence that play a role,” says Craig Lyon, director of road safety engineering at the Traffic Injury Research Foundation (TIRF). “They include overconfidence, sensation seeking, prevalent sleep deprivation and fatigue, and peer influences to engage in risky driving behaviours.”
Robyn Thomas is the director of commercial lines at Whitley Newman, an insurance brokerage based in Quinte West and Kingston, Ontario.
In her experience as a broker, the most common traffic convictions she’s seen from young drivers include driving under the influence, speeding, use of a handheld device, and failure to wear a seatbelt.
“Kids tend to want to play their music, or they're answering their phone on the screen next to them and they’ve got friends are in the vehicle,” she says.
When it comes to young drivers in rural areas, she often sees claims that result from single-vehicle accidents.
“You know, you end up in a ditch, or you hit a deer, because you don’t have as many cars on the road at the same time,” she says. “You’re not getting those rear-enders or sideswipes, or backing into somebody [that you would see in a city].”
However, fender benders are generally universal: “Kid backs up, hits somebody’s parked car because they weren’t paying attention,” she says. “They’re not backing in or not experienced enough to back in, and they clip somebody.”
All these infractions add up to risky driving habits and soaring premiums.
| Minor convictions | Major convictions | Serious convictions |
|---|---|---|
| Speeding over 40km/h over the posted speed limit | Speeding over 50 km/hr over the posted speed limit | Racing or stunt driving |
| Following too closely | Distracted driving | Impaired driving |
| Failure to signal before a turn or lane change | Failure to report an accident | Failure to remain at the scene of an accident |
| Failure to obey a stop sign | Speeding in a school zone | Failure to stop for a police officer |
| Failure to wear a seatbelt | Diving without insurance | Failure or refusal to take a breathalyzer test |
| Failure to produce a driver's licence or proof of insurance | Criminal negligence while operating or using a motor vehicle | |
| Manslaughter while operating a motor vehicle |
A young male driver pays over $3,000 more than a young female driver in insurance annually
According to premiums generated by the Rates.ca auto quoter, a 20-year-old driver living in Toronto with a recent model Honda Civic and no claims history can expect to pay $13,418 per year (assuming he did not complete an MTO-approved beginners drivers education course).
A female driver with the same profile can expect to pay $9,607 per year.
“Young people and males just have a higher threshold for risk in general,” says Lyon. “Although it's interesting, phone rate use is actually higher for females, but other risky driving behaviours, it's consistently males — speeding, aggressive driving, all that sort of stuff.”
Indeed, male drivers under 25 are 63% more likely to have serious/major tickets and 28% more likely to have speeding tickets than female drivers under 25, according to the Rates.ca quoter data.
“It's the males that are having the accidents, the males that are getting the convictions,” says Thomas. “Thinking about all these claims and minor statistics that come in. It's just statistics. Like it's just been years and years of stats built up.”
Thomas also suggests that young males also choose riskier cars, or commonly stolen vehicles, which can also affect the price of insurance.
In her experience, she says young men tend to opt for sportier and speedier models like the Honda Civic and Volkswagen Golf, as well as customized sound systems and mufflers, which can raise the value of the car.
In more rural communities, they gravitate towards older trucks without many modern safety features found in modern cars.
“Guys love their pick-up trucks, right?” she adds.
Read more: The best way for high-risk drivers to get car insurance
Inexperience affects drivers both young and old
It isn’t fair to blame the young for their youth; people of any age can drive distracted, tired, or sharing their car with peer passengers. Often, the biggest risk factor is inexperience – and inexperience impacts people of any age. It just happens that young people have not had enough time to gain solid time on the roads.
The tendency to misjudge speeds and stopping distances are directly linked to speeding and running reds, and these are aspects of inexperience, not youth, says Lyon.
“Hazard detection, anticipation and mitigation skills are more complex and often take longer driving time and more experience to master them,” he adds.
In Ontario and other provinces, some amount of driving experience is built into the graduated licensing process: As soon as you complete the written test and receive your G1 you can start driving with a fully licensed co-driver in the passenger’s seat beside you.
“You can start whether you're 18 or you start when you're 36,” says Andrew Marek, chief growth officer/chief AI officer at Young Drivers of Canada. “You still have to go through that process where you’re accompanied, and then you move to the next grade of limitations, and then you become fully licensed. There’s a time period.”
Inexperience can also be helped along with a Ministry of Transportation-approved Beginners Training Education (BDE) course like Young Drivers of Canada, DriveWise, or All Nations Driving School.
In order to graduate from a BDE course, drivers need to finish 20 hours of in-class (or online) theory, 10 hours of home study, and 10 hours of in-car lessons with a licensed instructor.
In addition to learning safer driving habits, successfully completing driver’s training allows drivers to take their G2 a few months earlier, and save money on insurance.
So, while the 20-year-old male driver who opted for no discounts or drivers training might be quoted around $13,418 for insurance, he can save almost $2,000 just by taking a BDE. His premium would be $11,485.
Drivers are getting licensed later in life
For some people, getting licensed is a rite of passage and a key to freedom. But for an increasing many, it’s born out of necessity.
According to Marek, the average age of a Young Drivers student was between 16 and 18 years old around the year 2000 and earlier. However, in the past 12 years, the typical student is 20 years old.
Province-wide, nearly 30% of Ontario G1-holders belong in the 25 to 34 age-cohort — slightly less than those age 16 to 20, which made up 32% of all G1-holders. Those aged 25 to 34 also made up 28% of all G2-holders.
There are many reasons why people are putting off getting licensed. First, there’s the sheer cost of owning a car. And then there’s competitive forms of transportation, from transit systems to bikes and e-bikes, and the prevalence of rideshare companies like Uber and Lyft. And, most significantly, there is anxiety.
“We're seeing the anxiety levels of new drivers increasing,” says Marek. “We actually had to come up with an anxiety reduction driving program last year because anxiety transcends whether the new driver is 16 years old or the more mature driver.”
Anxiety was the number one reported reason why people are holding off driving, he adds. And what gets drivers on the road in the end, is simply not being able to put it off any longer.
“They eventually said ‘We have to drive because we have to get to school; have to get to work; have to go to the office’,” he says. “The necessity was there.”
However, putting off driving may have its benefits: A male driver licensed at 34 years old and who goes through driver’s training can expect to pay around $7,612 a year for insurance — nearly $4,000 less than a 20-year-old male driver with the same experience.
Read next: What discounts can lower your auto insurance premium?
Usage-based insurance rewards safe drivers with up to 30% in premium savings
By Aya Al-Hakim
Usage-based insurance (UBI) is reshaping how premiums are calculated, shifting the focus from static factors like age or driving history to real-time driving behaviour.
Through a plug-in device or smartphone app, insurers monitor habits like speed, braking, and time of day to build a personalized driving profile. For safe drivers, it’s an opportunity to take control of their costs and unlock significant savings.
How much can I save with UBI?
UBI tends to have the most promising impact on new, young, or low-mileage drivers, though it can benefit a wide range of drivers depending on their habits.
“The discount is a flat 5% or 10% upon sign-up with all providers,” says Daniel Ivans, Rates.ca insurance expert and licensed insurance broker. “The discount changes at renewal, typically one year later, depending on what is tracked.”
For example, a new driver starting with a base annual premium of $3,000 and receiving the standard 10% discount for enrolling in a UBI program would pay $2,700 in their first year.
Younger drivers are more likely to stick with UBI
UBI is gaining traction, especially with younger drivers who typically face the highest premiums.
While only 15% of customers currently have a UBI policy, nearly a third of non-users say they’d consider switching if it meant saving just 5%, according to the Rates.ca Annual Best Auto Insurance Study
Among those who do use UBI, most report a smooth experience. Ninety-five percent say setting up their policy was easy, and more than half find UBI “very valuable.”
Younger drivers are especially enthusiastic: 71% of 16–29-year-olds and 70% of 30–39-year-olds with UBI policies say they’re likely to stick with UBI, compared to just 49% of those over 70.
Ivans says that’s because UBI shifts the focus from age-based risk to actual driving behaviour—giving younger drivers a fairer shot at lower premiums based on how they drive, not how old they are.
What are the long-term benefits and limitations?
While the upfront savings may be appealing, safe driving over time can lead to even more savings—up to 30% with programs like IntelliDrive, which evaluates behaviour over a 90-day period, Ivan points out. But that’s not guaranteed.
Drivers with riskier patterns may see their premiums increase.
Generally, insurers reward safe drivers with lower rates because they’re less likely to file claims, but UBI introduces variability that may not work in every driver’s favor. A single month of poor driving—due to weather, stress, or unavoidable circumstances—can impact your renewal rate.
UBI isn’t a one-size-fits-all solution, but for drivers who value transparency and are confident in their habits, it offers a compelling way to save and shift control back into the hands of the insured.
Read next: As insurance premiums rise, quotes for usage-based auto insurance increase by nearly 20%
Despite modern distractions, the roads themselves are safer
There are certainly enough reasons to be anxious on the roads, especially now.
“There are more opportunities for driver distraction with personal electronic devices and in-car systems in modern vehicles,” says Lyon. “The increasing size of vehicles has resulted in more blind spots for drivers and increased risk of injury for vulnerable road users and drivers of smaller vehicles.”
Vi Bilägare, a Swedish car magazine found that modern car touchscreens can take between 13.5 to 45 seconds to perform simple tasks like changing the radio station or adjusting the air conditioning. In comparison, it took 10 seconds for a 2005 Volvo. As a result, many car manufacturers are rethinking the knob.
Fatalities decline nearly 30% from two decades ago
However, despite these new risks, and all the old existing risks, research from Transport Canada found that road safety has improved over the past few years – at least when it comes to fatalities and collisions.
Road fatalities have decreased by 28% and serious injuries are down 41% compared to 20 years ago, when that 2005 Volvo above was fresh from the lot. The number of fatalities and serious injuries ticked up between 2022 and 2023 by 1.7% and 0.9% respectively, but overall injuries decreased 3.6%.
We’re faring much better than our neighbours to the south, too. A joint study between TIRF and the Insurance Institute for Highway Safety (IIHS) found that while road fatalities remained relatively stable between 2007 and 2021 in the U.S, Canada saw a decline of 22%.
“Over time, both countries have been improving despite populations growing,” says Lyon. However, around 15 years ago, the two countries diverged. “It wasn't so much like the US is getting worse. It's more like they plateaued. Their fatality rates have gone up, but they've gone up as you would expect with more people driving. Whereas, Canada has continued to go down.”
His team found that some of the biggest reasons for this decline in fatalities were policy-related, including tougher penalties for distracted driving and drinking and driving, and seatbelt use.
“One of the issues in the US is they don't have strict laws, and they also don't enforce them as well,” he says.
Road fatalities between 2011 and 2022
Crash type | 2011 | 2020 | Percentage difference |
|---|---|---|---|
All fatalities | 2,166 | 1,776 | -18% |
Pedestrian and cyclist | 398 | 331 | -17% |
Motorcyclist | 173 | 250 | 45% |
Truck-involved | 360 | 273 | -24% |
Alcohol-involved | 508 | 356 | -30% |
Seat belt related | 536 | 450 | -16% |
Speed-involved | 546 | 449 | -18% |
Young driver-involved | 288 | 138 | -52% |
Senior driver-involved | 390 | 341 | -13% |
(Source: A comparison of recent crash fatality trends in Canada and the United States: Why do they differ?)
Better infrastructure and automated enforcement work
Another reason why fatalities and injuries have declined in the past 20 years? Safer streets – literally.
“We are seeing improvements to the road network that increase safety such as roundabouts and protected intersections,” says Lyon.
Complete streets, which consider the uses of all road and sidewalk-users (like drivers and cyclists, but also pedestrians, wheelchair users, window shoppers, parents with strollers, sidewalk patio diners, etc.) also help create a safer driving environment.
Automated speed enforcement also contribute to safer streets, despite a recent Ontario-wide debate on the efficacy of speed cameras.
Slower speed limits allow drivers more time to react to sudden hazards, softens the impact in the event of a collision, and allows drivers a wider field of sight when driving.
Distracted and dangerous driving are habits we need to break
By Igal Mayer, President and CEO
There’s no doubt that Canadian roads are safer than they were 20 years ago. But recently, we’ve seen a disturbing trend in the wrong direction: road fatalities are on the rise after a decade of decreases. According to the latest data from Transport Canada (2023), the number of motor vehicle fatalities was up 1.7% from 2022 and was the highest count in the last 10 years. Why is this?
There is no single answer to this question. Rather, it’s a confluence of factors, from driving culture and enforcement to vehicle design and distracted driving habits.
Anyone who drives in the GTA will have witnessed drivers weaving in and out of traffic at high speeds, cutting off other vehicles or refusing to allow another car to merge. While no country can claim perfect drivers, many can claim a much calmer and more ordered driving culture.
The UK, for example, has some of the safest roads in the world, thanks in part to a concentrated effort to build a strong culture of driving etiquette, which is encouraged through long-running responsible driving campaigns and enforcement of dangerous driving penalties.
We could learn from this. It’s telling that in the GTA speed cameras, which are proven to reduce speeds and increase safety, especially in school zones, are routinely vandalized and the provincial government has promised to ban them. Encouraging safer driving habits requires an ongoing, dedicated mix of policy and enforcement.
Elements of modern vehicle design also encourage bad driving habits. Powerful engines make cruising at high speeds exponentially easier. In the ‘90s, only high-end sports cars such as Ferraris or McLarens could go from 0-60km in seven seconds — now most cars can do that. Not only are vehicles more powerful, they are significantly larger, making maneuvering in crowded streets more challenging, and pedestrians — especially children — more difficult to see.
We are also more distracted in our vehicles than ever before. In most vehicles sold today, drivers control everything from air conditioning to music through a touch pad screen and the majority have a smartphone within easy reach. It takes more time and attention to key in a change in the air conditioning temperature than it does to turn a dial, and it’s an ongoing temptation to text and drive that not everyone is able to resist. For some, usage-based insurance, which rewards safe driving habits with insurance discounts, could be a motivator to leave the phone and dashboards alone when on the road.
None of these problems exist in isolation, and there isn’t just one solution to safer driving. Changing manufacturing regulations, publicity campaigns and increasing enforcement of dangerous driving penalties are all valid strategies that should be pursued, but they are also expensive, time-consuming and could take years to show results. That doesn’t mean we shouldn’t try. But one thing each individual driver can do right now is work on creating a calmer, safer driving culture. Let that driver in ahead of you. Slow down if you’re speeding. Resist the urge to tailgate that Tesla that just cut you off. We’ve taken many cues from the UK over the years — our style of governance, universal health care and arguably, our sense of humour. Why not a culture of safe, responsible driving as well?

"The science is in — Speed cameras work"
In September, amidst a spate of vandalized speed cameras, Premier Doug Ford launched a campaign against automated speed enforcement (ASE), calling them a “tax grab” by municipal governments and proposing to replace speed cameras with speed bumps and more roundabouts.
However, TIRF identified ASE as a key contributor to decreased fatalities.
Between 2011 and 2021, the U.S. saw 22% more speed-related fatalities. While the U.S. also has speed cameras, they cover a smaller share of the population than in Canada.
During this period, Canada saw a 18% decrease in speed-related fatalities.
While this improvement can’t be purely attributed to speed cameras alone, the combination of lowered speed limits, infrastructure changes, and ASE work together to keep speeding down.
“Automated enforcement is a tool proven to increase safety by reducing speeding and red-light running,” says Lyon. “The science is in – they work, they reduce speeds, and they reduce crashes. There’s no doubt about that.”
The kids are all alright – but their insurance rates aren’t
An inexperienced 20-year-old male driver with their own insurance policy who uses their car to commute to work or school can expect to pay over $10,000 a year for insurance – and that’s with discounts associated with drivers training and telematics. A female driver of the same age can expect to pay between $8,000 to over $9,000.
And if these drivers get into a collision or receive a traffic ticket, that insurance rate is likely to go up.
However, Robyn Thomas says, young drivers won’t be saddled with high insurance rates forever.
“You still have to build your experience,” she says. “You still have to put in your time. You do start to see savings at the full three-year mark, and 25 years old is around the time that you’re treated like anybody else.”
Until then, she recommends choosing a safer car that has advanced safety features and isn’t prone to theft. She also stresses the importance of staying vigilant on the road.
“Don’t make a decision that would cause you to be in a higher risk of having an accident,” she says. “So have that designated driver – but maybe you only have three people in the car, versus four, loudly yelling.”
Lastly, she recommends all families talk to their brokers to find a situation that works for them, whether it’s listing your child as an occasional driver, opting for a multi-vehicle discount or removing parts of coverage where it’s not needed.
“That’s where the broker comes in,” she says. “They play with the market and figure out what's the best option and give two or three options to clients so then they can make the decision that works.”
Practice makes perfect, and you can’t rush perfection. But what you can do is slow down, check your blind spots, keep your phone in your bag, and heed traffic laws – and that’s not nothing.
Methodology
All estimated premiums are based on the three lowest average quotes returned for a 20-year-old male (unless otherwise noted) living in Toronto who drives a 2024 Honda Civic four-door with a claim and conviction-free driving record, averaging 10,000 kilometres per year (or five kilometres a day). Our persona also purchased two optional insurance coverages, collision and comprehensive insurance with a $1,000 deductible.
The traffic ticket statistics were gathered from analyzing 147,326 entries from the Rates.ca auto insurance quoter using self-reported demographic and traffic conviction histories from users across Ontario who visited the site between June 1, 2024, and July 1, 2025.
For media inquiries, please contact:
Laura Fitch
Director of Editorial and PR
Rates.ca
Latest home insurance articles:
As the real estate market fluctuates, doing minor, strategic renovations may help improve your home equity and offset falling home values.

A comprehensive home insurance policy can help you cover significant repair costs from a water-damaged basement.

How to reduce risk of your car getting caught in an underground parking garage flood and details on your insurance coverage options.
Consider short-term home insurance additional options before you rent out your home to FIFA World Cup 2026 soccer fans.

Spring landscaping can affect your insurance. Minor grading changes can send water toward foundations, raising flood risk.

A backwater valve is a gate mechanism added to your wastewater outflow pipe that prevents city sewage from flowing back into your home.