Choose an Insurance Quote
Mapping risks across Ontario as
home insurance premiums rise
6.2% YoY in 2026
Jump to:
- Most expensive cities for home insurance in Ontario
- Least expensive cities for home insurance in Ontario
- What are key risks driving premium increases?
Show more
- Rise in home replacement cost drives premium increases
- High risks of wind/hail and system backup across Ontario
- Why mitigating wildfire risk prevents significant future losses
- Why high risk of crime doesn't mean higher insurance premiums
- Your home insurance premium went up, but you’ve never made a claim: Why?
- How to optimize your coverage
- About Home Insuramap


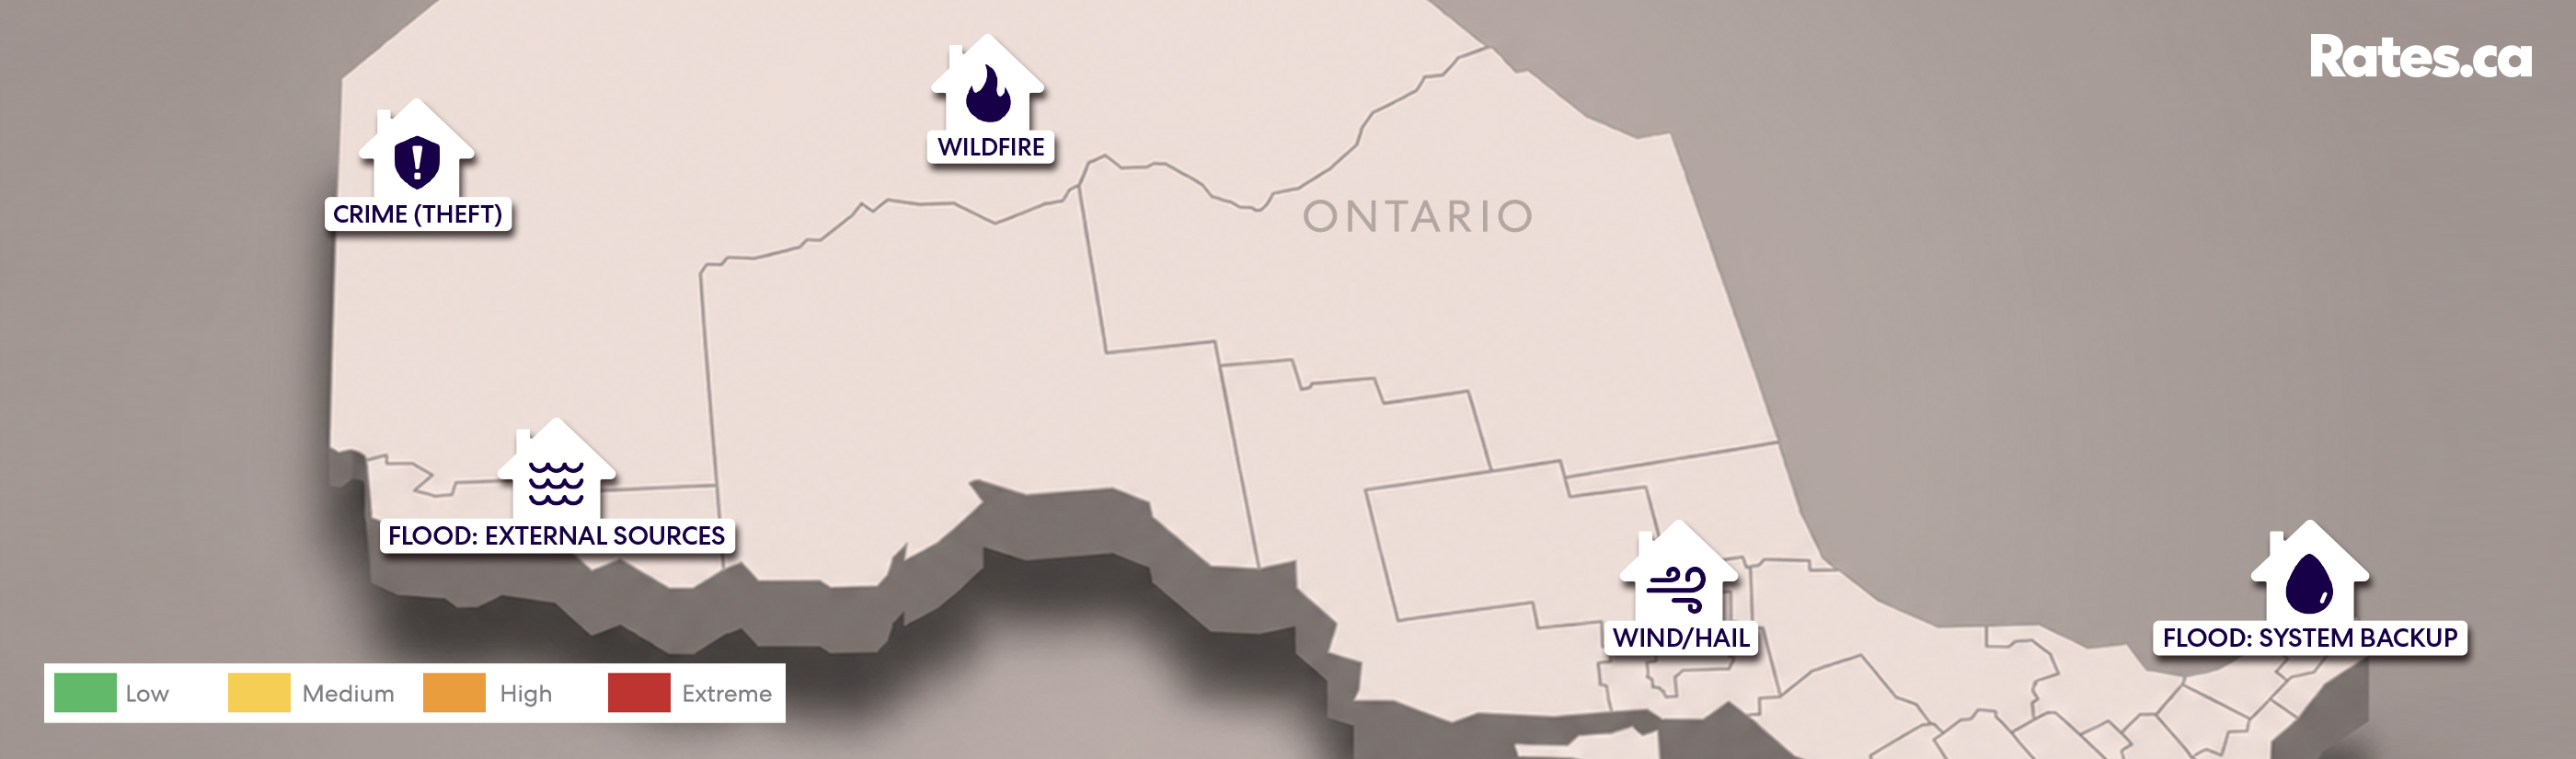
Ontario home insurance premiums are up 6.2% year-over-year in 2026, according to the latest Rates.ca Home Insuramap data. A new interactive map tool premiered with our 2026 report allows users to track five risks across Ontario neighbourhoods:
- Flood: Exterior sources: Risk of flooding from external sources, such as heavy rainfall, snowmelt, or overflowing rivers.
- Flood: System backup: Risk of water damage from flooding originating from backed up sewers, sump pumps, and septic tanks.
- Wind/Hail: Risk of damage to homes from strong winds—such as those from storms, tornadoes and derechos, and hail.
- Crime (theft): Risk is based on theft and the expected value of stolen goods, taking into account both the frequency and severity of theft, and excludes other types of crime, such as assault, arson, etc.
- Wildfire: Risk of damage from wildfire and smoke.
A few important definitions to understand our risk scoring metrics:
- High-risk profile: reflects a score of high or extreme risk in three or more perils
- Low-risk profile: reflects a score of low to medium risk in three or more perils
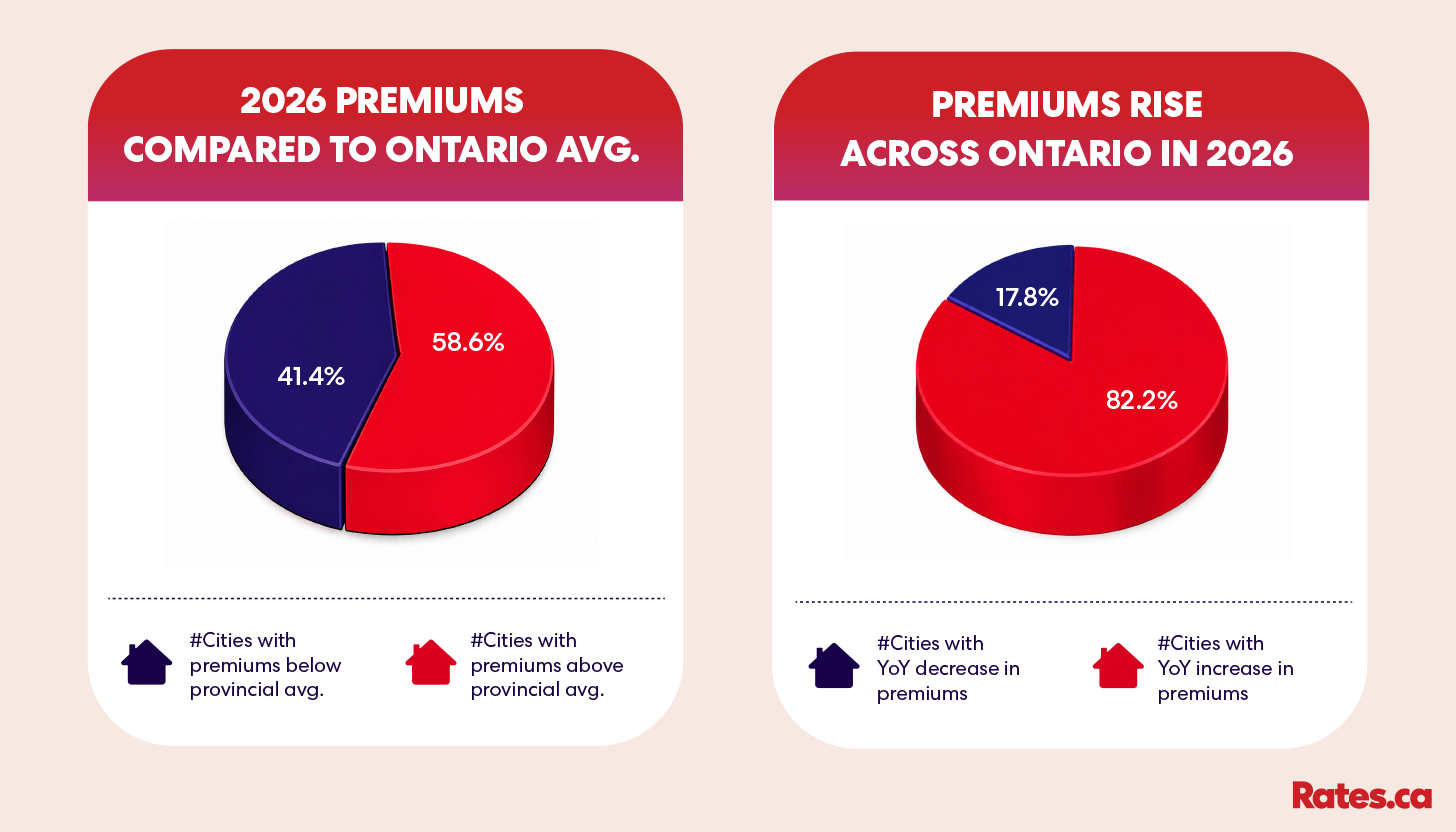
Due to a combination of these risk factors, premiums rose YoY in 157 or 82.2% of Ontario cities in 2026. On the low end, premiums fell as much as 7.1% YoY. A little over 95% of neighbourhoods have a low-risk profile. For 2026, the average estimated home premium for the whole province stands at $2,235 per year.
Insuramap premiums were retrieved using the profile of a homeowner in their 40s living in a 2,500-square-foot detached house. The risk assessment data was supplied separately by a leading global insurance data, analytics, and technology provider. Check our full methodology* to find out how we determined premiums and risk scores.
This report will delve into the reasons behind the pricing as well as provide a full breakdown of the least and most expensive cities for home insurance in Ontario.
Key findings:
- Ontario’s top 10 most expensive cities are all north of the GTA, with premiums ranging from 35% to 48.6% above the provincial average.
- Cochrane is Ontario’s most expensive city for home insurance in 2026, at $3,322 per year, 48.6% above the provincial average and up 16.3% YoY.
- Southern Ontario cities dominate the least expensive list, with Newmarket having the lowest premium, at $1,709 per year, 23.5% below the provincial average.
- Wind/hail and system backup are two of the most widespread weather-related risks in Ontario, with high wind/hail affecting 35.4% of postal codes and system backup 32.5%.
- Though more than half of Ontario scores high on crime risk, this does not necessarily translate to higher home insurance premiums.
- Less than 1% of Ontario’s postal codes face high wildfire risk, with most being concentrated in northern parts of the province.
Most expensive cities for home insurance in Ontario
Cochrane, a town in northeastern Ontario, topped the list of most expensive annual home insurance premiums at $3,322—a 16.3% increase YoY. The town’s sole FSA (Forward Sortation Area, the first three digits of a postal code), P0L, has high risks of flood: system backup, wind/hail, and crime.
Towns with the highest premiums are between 35–48.6% above the Ontario average. All of them are in northern parts of the province, with Cochrane, South Porcupine, Chelmsford, Kapuskasing, Iroquois Falls, and Garson falling more to the west, and Fort Frances, Minakim, Emo, and Beardmore to the east. Seven of the top 10 cities are repeats from 2025, including Cochrane, Fort Frances, South Porcupine, Minaki, Emo, Chelmsford, and Kapuskasing.
None of this is surprising. Northern cities have historically had higher premiums than their southern counterparts. Many of these cities are in remote areas, which often equates to high rebuild costs and poor access to essential amenities and services.
Rank | City | 2026 premium | 2025 premium | YoY% change | % vs. ON avg. |
|---|---|---|---|---|---|
1 | Cochrane | $3,322 | $2,855 | 16.3% | 48.6% |
2 | Fort Frances | $3,287 | $2,998 | 9.6% | 47.1% |
3 | South Porcupine | $3,262 | $2,871 | 13.6% | 46.0% |
4 | Minaki | $3,216 | $2,967 | 8.4% | 43.9% |
5 | Emo | $3,111 | $2,872 | 8.3% | 39.2% |
6 | Chelmsford | $3,109 | $2,795 | 11.2% | 39.1% |
7 | Beardmore | $3,104 | $2,708 | 14.6% | 38.9% |
8 | Kapuskasing | $3,085 | $2,783 | 10.9% | 38.0% |
9 | Iroquois Falls | $3,085 | $2,744 | 12.4% | 38.0% |
10 | Garson | $3,038 | $2,675 | 13.6% | 35.9% |
Source: proprietary Rates.ca quotes; green highlights show ranking repeated two years.
Steve Cohen, Rates.ca’s VP of Insurance and Chief Underwriting Officer, explains that insurance companies often factor in proximity to fire services and hydrants when pricing home insurance policies. In addition, fewer contractors in those areas leads to higher demand for their labour, and therefore, higher costs. Building components also tend to be in short supply in those localities, necessitating additional transportation costs.
Least expensive cities for home insurance in Ontario
Rank | City | 2026 premium | 2025 premium | YoY% change | % vs. ON avg. |
|---|---|---|---|---|---|
1 | Newmarket | $1,709 | $1,716 | -0.4% | -23.5% |
2 | Concord | $1,769 | $1,841 | -3.9% | -20.9% |
3 | Woodbridge | $1,788 | $1,812 | -1.3% | -20.0% |
4 | Guelph | $1,808 | $1,696 | 6.6% | -19.1% |
5 | Whitchurch-Stouffville | $1,810 | $1,885 | -4.0% | -19.0% |
6 | Maple | $1,823 | $1,838 | -0.9% | -18.4% |
7 | Stratford | $1,824 | $1,844 | -1.1% | -18.4% |
8 | Waterdown | $1,842 | $1,984 | -7.1% | -17.6% |
9 | Burlington | $1,851 | $1,820 | 1.7% | -17.2% |
10 | Aurora | $1,851 | $1,952 | -5.2% | -17.2% |
The top 10 cities with lowest annual home insurance costs in 2026 are located in southern Ontario. Premiums for all 10 cities track well below the 2026 provincial average and two cities show YoY premium increases. Four of these cities: Concord, Whitchurch-Stouffville, Waterdown, and Aurora also featured in the least expensive list in 2025.
Aurora, Whitchurch-Stouffville, and some areas in Burlington, Guelph, and Woodbridge have a low-risk profile that aligns with their least expensive premium ranking. But in other areas, home insurance pricing is nuanced and not always directly correlated to peril scores.
FSAs in Newmarket and Concord, have a low-risk profile for four perils, but score high on crime. Four of Burlington’s five FSAs and one of two Woodbridge neighbourhoods are on the high end of the risk spectrum for wind/hail and crime. Similarly, the two Stratford FSAs and two of six Guelph neighbourhoods face high risk of wind/hail.
What are key risks driving premium increases?
We have identified that crime (theft), system backup, and wind/hail are some of the most prevalent risk factors in Ontario, while wildfires and floods impact only small pockets of the province.
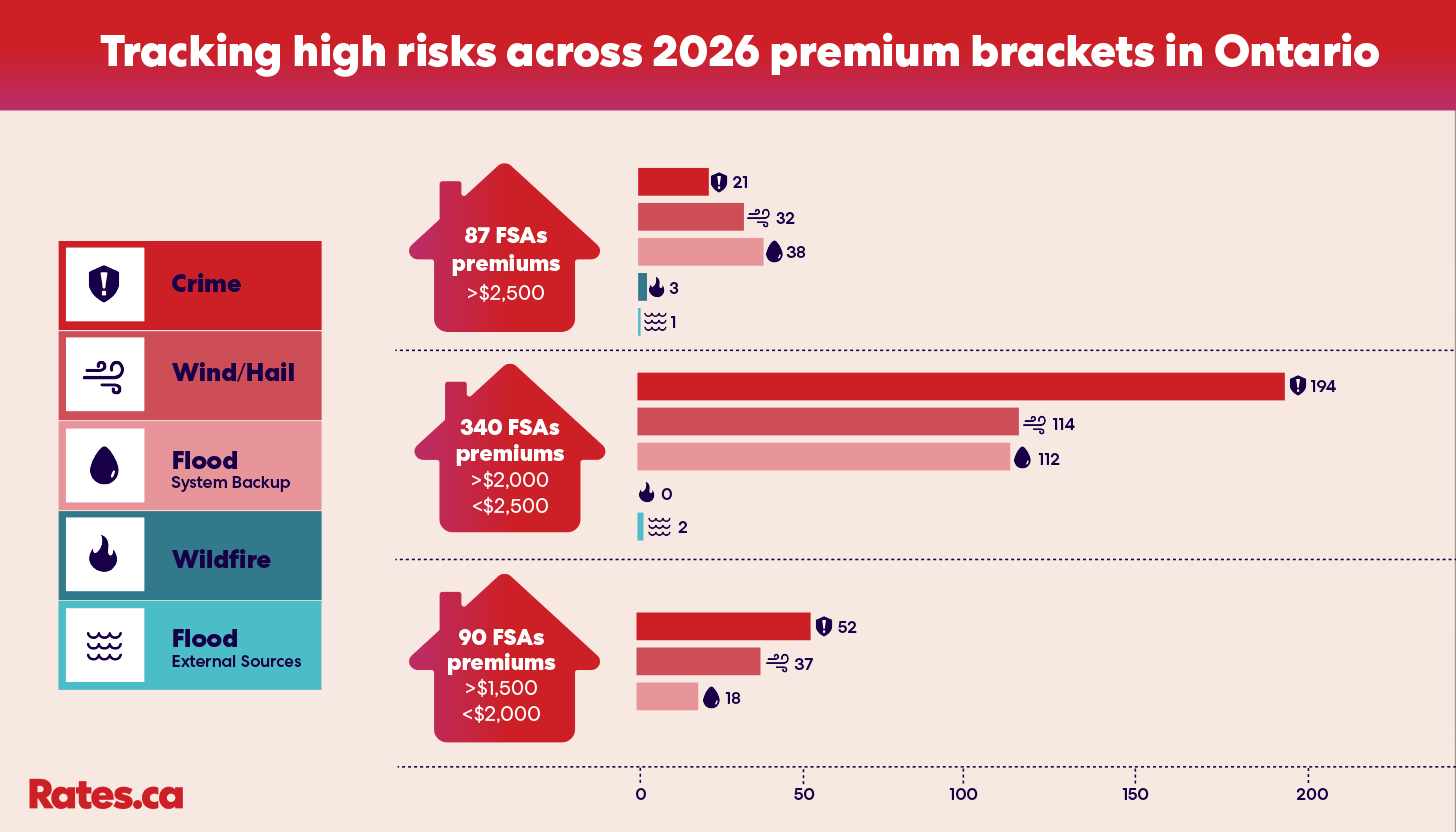
Source: proprietary Rates.ca quotes; peril scoring from global insurance data, analytics, and technology provider; AI-generated infographic.
Most FSAs in Ontario pay annual premiums of $2,000 to $2,500. Out of 340 FSAs in this premium range, two FSAs—N8S and N8X—are at a high risk of floods from exterior sources, both of which are in Windsor. N8X has the higher premium at $2,471 or 10.6% above the provincial average, possibly because, in addition to flood, it has a high-risk profile across three more perils: system backup, wind/hail, and crime (theft).
There are only 13 more FSAs in this premium range at a high risk of the same three perils. Among them is L6S in Brampton, which has the second-highest premium in this bracket, after N8X in Windsor, at $2,289 or 2.4% above the provincial average.
In the $1,500 to $2,000 premium range, six out of 90 FSAs rank high across at least three perils, with L5N in Mississauga having the highest premium of the group at $1,990 per year or 11.0% below the provincial average. The three overlapping perils are again system backup, wind/hail, and crime (theft). All six FSAs have premiums below the provincial average.
In the above $2,500 premium range, there are two FSAs with a high-risk profile across the common perils like system backup, wind/hail, and crime (theft). These areas are N8M in Essex and P0L in Cochrane, with the latter having the highest premium in Ontario, at $3,322 or 48.6% above the provincial average.
In this premium range, Sudbury FSAs track as high risk in three different perils: wildfire, system backup, and wind/hail, with an average premium of $2,684 or 20.1% above the provincial average.
The premium range has only one FSA with a high risk of flood from exterior sources: P4R in Timmins, with a premium of $3,128 or 40.0% above the provincial average.
Though crime (theft) appears prominent across all these premium ranges, it is worth noting that severe weather still accounts for most property damage in the province.
The latest report by Catastrophe Indices and Quantification Inc. (CatIQ) shows that catastrophes from extreme weather events cost over $2.4 billion in insured losses nationwide in 2025. An ice storm that hit parts of Ontario and Quebec in late March 2025 cost over $490 million.
According to Daniel Ivans, Rates.ca insurance expert and licensed insurance broker, crime‑related home insurance claims remain relatively minor compared to claims driven by weather‑related events.
“Flooding, severe storms, wildfires, and other climate‑driven losses continue to far outweigh theft or break‑and‑enter claims in both frequency and severity,” he says.
Rise in home replacement cost drives premium increases
One of the sometimes less-talked-about factors that influences home insurance premiums is home replacement or rebuild cost—the amount it would take to rebuild a home from ground up to its original state in today’s market. This factors in inflation, labour costs, and materials used in the construction of a home. The higher any of these amounts are, the more it will cost to rebuild the home, which translates to higher premiums.
Source: proprietary Rates.ca quotes; AI-generated infographic.
A recent report by Verisk shows that residential rebuild costs in Ontario increased 23.8% between January 2021 and January 2026, with a 12.1% increase over the past three years. As of 2026 Q1, YoY component costs are up 3.8% in Canada, with roofing and aluminum siding show strongest growth at 4.9% and 4.6%, respectively. Ontario is in the second place among provinces showing YoY component cost growth of 4.4%, while British Columbia is in the first place at 4.7% YoY.
There is also a growing shortage in skilled trades in the residential construction sector. Since 2017, job vacancies have increased at an average rate of 11% per year. The number is projected to rise to 13% per year between 2026 and 2045.
A rise in weather-related property damage means higher demand for construction and additional strain to the labour supply.
“Labour shortages lengthen rebuild and renovation timelines, and increase construction costs,” says Ivans. “These in turn increase claim costs, and eventually, drive up premiums.”
When thinking of labour and material costs, it is worth noting that they operate differently from your standard perils like system backup or theft. “Perils are event-driven,” says Ivans, “while rebuild costs are a slow and steady pressure that compounds over time.”
From a timeline perspective, a peril such as system backup can influence your premium in the span of a year if there are enough claims filed for it. This means that in a high-claim environment, home replacement cost doesn’t influence the premium as much as those perils. It is more of a ‘background’ factor.
“It's possible in a low-claims environment for replacement costs to eclipse weather-related damage,” says Ivans, “but right now, climate-related losses are still generating billions in annual claims across Canada, so that threshold is a long way off.”
High risks of wind/hail and system backup across Ontario
by Arshi Hossain
High risk of wind/hail hits 35.4% of Ontario's postal codes. System backup threatens another 32.5%. Our risk data covering all 517 FSAs across Ontario shows system backup concentrates in older urban cores, while wind/hail spreads evenly province-wide. The 7% of FSAs where both risks overlap face compounded vulnerability.
Between 2015 and 2025, property insurance premiums in Canada inflated 78% cumulatively—nearly double the G7 average, according to Dr. Jason Thistlethwaite, associate professor at the University of Waterloo's School of Environment, Enterprise, and Development.
"I have no problem calling it a property insurance affordability crisis," he says, projecting continued 10% annual increases.
Dual risk-exposed areas
For roughly 7% of Ontario where both risks overlap, neighbourhoods carry a double risk premium. Flood risk in Canada follows a stark pattern. "One percent of properties account for 40% of the annual damage," Dr. Thistlethwaite says. "It's basically the same properties over and over, and over again." When insurers identify areas with recurrent losses—system backups hitting repeatedly, wind and hail claims clustering—they price accordingly, not just for those who filed claims, but for everyone sharing the risk profile.
David Mayer, Director of Insurance at Rates.ca, confirms this: "If a handful of streets generate a disproportionate number of sewer or water damage claims, that entire FSA can absorb the repricing, including neighbours that never filed a claim."
Two Ontario FSAs carry the highest combined burden: extreme wind/hail risk layered over high system backup exposure. K4K Clarence-Rockland tracks with its dual risk: $2,327, 4.1% above average, up 5.8% annually.
Postal codes N0A and M6B score high on two of five perils: system backup and crime, with above average annual insurance costs.
Singular risks for certain areas can be significantly impactful as insurers weigh certain risks higher than others when setting insurance rates. Thunder Bay’s P7J faces extreme system backup but low to moderate risk on the other four perils. P7J premiums sit 28.1% above the provincial average. Similarly, premiums track above the 2026 average in P3Y, L9X, L0B, L0A, and L0R neighbourhoods with an extreme rating in a singular risk category of wind/hail.
In some instances, risk scores and premiums don’t always align given insurance rates are a combination of variables. K6H Cornwall sits below average at $2,203 and Ottawa’s K2S with extreme risk for wind/hail and a high scoring in system backup and crime (theft) shows premiums decline 1.7% YoY, 6.3% below average. Similarly, L5N in Mississauga tracks 11% below average, down 2.4% YoY with high risk in three perils: system backup, wind/hail, and crime (theft).
System backup is concentrated in urban cores
While wind and hail disperses across Ontario, system backup concentrates in older urban municipalities. 50% of the flagged FSAs for system backup risk sit in the Greater Toronto Hamilton Area (GTHA)—Toronto, North York, Etobicoke, Scarborough, plus Brampton, Mississauga, and Hamilton.
Thistlethwaite explains why losses run high: "You have a lot of people with a lot of property that's worth a lot of money." GTHA basements aren't bare concrete, they're finished living spaces with expensive utilities. "When your heating system gets wet, that gets very expensive."
High density, high values, and aging infrastructure create costly claims.
Etobicoke shows the starkest concentration: 100% of its FSAs flag high for system backup risk, with 2026 premiums averaging $2,290, up 4.1% YoY. Three FSAs saw double-digit spikes—M9R jumped 14.7%, M9P 12.9%, M9A 9.9% in one year.
Many older Toronto neighbourhoods still run on combined sewers—stormwater and sewage sharing one pipe. "They're not supposed to be combined. But unfortunately, you do have a lot of that infrastructure," Thistlethwaite says. When intense downpours hit, the system fails. Water enters through drains, below-grade windows, and basement openings, flooding finished spaces.
Across all 168 high-risk FSAs, 57.1% show premiums above the provincial average.
Coverage gap behind your home’s weather risk
When people hear "flood," they picture overland flooding. But flooded basements often result from system backup—water forced up through drains when the system is overwhelmed.
Overland flood and system backup are separate, optional endorsements. Wind/hail is included in many comprehensive policies. Many homeowners assume "water is water", until they're not covered.
Kiva Bottero, director of Green Building Canada explains: "When a sewer backup happens, aging infrastructure is usually the reason. But whether or not your home actually floods largely comes down to building design and what protective measures are in place."
Homeowners can't fix municipal infrastructure, but they can control how their property responds when it fails.
What homeowners can actually do
For those in high-risk areas watching premiums climb, start with essentials, then layer in what you can afford.
For system backup:
- Install a backwater valve and sump pump with battery backup—both qualify for insurance discounts. As of May 2026, Toronto offers subsidies up to $6,650.
- Disconnect downspouts to catch water in rain barrels or divert into rain gardens.
- Ensure water flows away from foundation, neighbours, and road with proper slope.
- Add green infrastructure (rain gardens, swales, green roofs) to reduce sewer burden during storms.
"Since water damage is the number one home insurance claim in Ontario, if you're in an area at risk of sewer backup, it's worth focusing on retrofitting efforts," Bottero says.
Beyond that, he advises redirecting water to ground level.
For wind/hail: Replace your roof with Class 4 impact-resistant metal roofing. "Roofs take the most damage, so if you're going to make one change, change your roof," Bottero says.
For double risk-exposed FSAs, a roof upgrade paired with a backwater valve and sump pump covers the highest impact bases.
Why mitigating wildfire risk prevents significant future losses
by Joan Pinto
Our data shows moderate wildfire risk affects 23 FSAs or 13 cities in Ontario. Three of five areas in Sudbury—P3E, P3C, P3A, or less than 1% of provincial FSAs, face high wildfire risk.
Compared to the frequency of other perils across Ontario FSAs, wildfire risk seems negligible. Yet wildfires in Canada are devastating.
Based on a 30-year history, almost 7,000 fires occur each year and burn an average of 2.7 million hectares, as per Government of Canada’s National Fire Database.
Trends and future wildfire risks
Even as the annual number of wildfires declines, areas burned has been increasing. “What is changing is the geography and intensity of wildfire risk,” says Dr. Anabela Bonada, faculty of Environment at the University of Waterloo, Ontario.
Historically, highest wildfire risk was concentrated in northern Ontario and across boreal forests of highly combustible conifers. Wildfires are part of a natural and necessary ecological process that helps remove dead and pest-damaged vegetation, creating space for forest renewal.
Southern Ontario’s deciduous forest cover and different landscape conditions have generally been considered low wildfire risk, Dr. Bonada says. But periods of extreme heat and drought can dry out vegetation quickly. “This means wildfire risk is not only a northern Ontario issue,” she cautions.
Cottage-country regions, rural communities near forests or grasslands, and agricultural areas where dry crops, grasses, ditches, and field edges can become highly flammable during hot, dry, windy periods. “A grass fire, roadside ignition, or fire in nearby vegetation can spread toward homes, cottages, farms, and communities, especially when winds are strong and vegetation is dry,” Dr. Bonada says.
“This means wildfire risk is not only a northern Ontario issue.”
Government of Canada forecasts for 2026 show above normal temperatures and below normal precipitation in northwestern Ontario—ideal conditions that increase fire danger. Bonada cautions cottagers and rural homeowners not to assume that wildfire risk is static, but to prepare before conditions deteriorate quickly after a few hot, dry, windy days.
Should El Nino conditions develop in 2026 as expected, Ontario could experience a warmer-than-normal winter 2026–27 with less snow. This could lead to an active wildfire season in 2027.
Do premiums reflect wildfire risk?
Our peril scoring data shows 2026 premiums in both high and moderate wildfire risk are above the provincial average. Sudbury’s P3E premiums are quoted as high as $3,144 or 40.7% above the provincial average. Yet, P3E ranks low in all other risk categories. P3A with 2026 premiums at $2,684 or 20.1% above the Ontario avg. also faces dual high risk of system backup and wind/hail. The P3C locality likewise handles high wind/hail risks. At $3,072, premiums for P3C in 2026 have risen 15.7% YoY, sitting 37.4% above the Ontario avg.
Kapukasing with $3,085 in annual premiums or 38.1% above the provincial average, faces moderate wildfires risk and high system backup. Within the Cochrane district of Northern Ontario, this town features on the top 10 list of cities with the most expensive home insurance premiums two years running based on Rates.ca proprietary data.
Measures to minimize wildfire risk
Prevention is always more effective than suppression. Canada has spent $1 billion annually in recent years on wildfire suppression, including firefighting efforts and equipment, the Waterloo University expert says.
The Ontario government is also investing in wildfire response through:
- Adding permanent wildland fire staff
- Increasing compensation for critical frontline roles
- Investing in new aircraft and suppression equipment
- Modernizing wildland fire management legislation
FireSmart Canada, a national program founded in 1993, helps Canadians increase neighbourhood resilience to wildfire and minimize its negative impacts. Dr. Bonada reminds homeowners and cottagers that homes can ignite from wind-blown embers that land on combustible materials near their property. Homeowners should:
- Create a non-combustible 1.5-metre zone around their home
- Remove dry leaves and debris from gutters
- Keep woodpiles and combustible materials away from buildings
- Manage vegetation within 10 metres of their home
Implementing actions on vegetation reduction and updating building materials to fire-resistant, can reduce the risk of home ignition by 75%, Dr. Bonada says. “For every $1 invested in preparedness, there are $2–10 in avoided losses in a 10-year period.”
Why high risk of crime doesn’t mean higher insurance premiums
by Aya Al-Hakim
More than half of Ontario—267 of 517 FSAs—score high on crime risk. In an insurance context, this refers to theft only and is weighted on the value of goods stolen. A high crime rating should not be taken as an indicator of frequency or prevalence of break-ins or number of claims. For example, a single claim with a high value of goods stolen could result in a high crime rating for an FSA. It also excludes other kinds of crime, such as assault or drug trafficking. An elevated risk profile for crime doesn’t translate into higher home insurance premiums.
For example, seven of the ten least expensive FSAs in Ontario—including parts of Mississauga, Richmond Hill, Ottawa, Burlington, and Markham—all have a high-risk profile for crime. Yet their premiums remain among the lowest in the province. It’s a signal that a high crime rating alone doesn’t drive insurance pricing.
“Crime is a real input into home insurance pricing, but it is a minor one compared to water, fire, wind, and rebuild costs,” says David Mayer, Director of Insurance at Rates.ca. “The crime penalty in home insurance is far smaller than most consumers expect.”
CEO of CSP Alarms, Anas Mustafa, says homeowners are interested in newer technology and security systems that offer real-time monitoring and added control.
He noted that “with social media as well, people are more aware of crime,” which has contributed to more homeowners exploring options. Insurers also typically check for the presence of security systems when setting home insurance premiums.
What actually drives premiums?
Across both the cheapest and most expensive markets, the same pattern emerges. Premiums tend to rise where multiple risks overlap.
In Cochrane (P0L), where system backup, wind/hail, and crime risk profiles are all elevated, the average premium reaches $3,322—about 48.6% above the provincial average and up 16.3% YoY.
South Porcupine (P0N), with high-risk profiles for crime and wind/hail, sits close behind at $3,262, up 13.6% YoY. Essex (N8M), with a high-risk profile across three risk categories, averages $2,771, with a more modest 6.3% YoY increase.
By contrast, areas where crime risk is high but other risks are more limited often see lower premiums.
In Brampton, for example, 90% of FSAs carry high crime risk, yet many of those areas still sit below the Ontario average premium of $2,235.
“Below-average home insurance premiums in Brampton aren’t necessarily a mystery or mispricing,” says Mayer. “They reflect newer housing stock, manageable claims history, and the simple fact that crime carries less weight in pricing than people think.”
That pattern holds even within the same city. In Ottawa, two neighbouring postal codes show how dramatically premiums can diverge. K1R, which carries an extreme crime score, averages $1,751, or 21.7% below the provincial average. Just one postal code over, K1K carries high crime and medium risk in system backup and wind/hail. Estimated premiums for K1K are $2,973, or 33% above average.
“That roughly 54-percentage-point spread within the same city is one of the clearest examples of how postal code pricing works,” Mayer says. “It’s not an anomaly—it shows that water risk is far more expensive to insure than crime. The risk that floods your basement costs more than the risk that breaks a window.”
In Toronto, premiums in some high-risk areas have risen over the past year, even where they remain below the provincial average.
M4W is one example. Premiums there sit just below the provincial average at $2,217 but rose 13.8% over the past year. Nearby M6B, with similar risk factors, saw an 8.3% increase and is quoted slightly above average. Several FSAs in Etobicoke have also posted YoY increases of around 9%.
Even so, the broader pattern remains consistent. While crime risk seems widespread, it is not the dominant factor shaping insurance pricing.
Your home insurance premium went up, but you’ve never made a claim: Why?
By Steve Cohen, Vice President, Insurance & Chief Underwriting Officer
Home insurance premiums in Ontario rose more than 6% year-over-year, outpacing general inflation and resulting in unwelcome increases on renewal policies for many homeowners across the province.
The question we hear most from policy holders is a fair one: Why?
Cost of your risk has increased
Despite common belief, insurers don't raise premiums because they want to. They raise premiums because the risk of insuring a home has increased.
Over the past decade, the cost of rebuilding a home skyrocketed and incidents of severe storms and wildfires increased in frequency and intensity. According to the Insurance Bureau of Canada, from 2006 to 2015 annual insured losses from severe weather events and wildfires totaled $14 billion. From 2016 to 2025, that number almost tripled to $37 billion, with the average number of claims nearly doubling at the same time. Meanwhile, the costs of building a detached home in Canada soared almost 70% from 2020 to 2025, driven first by pandemic supply chain disruptions, then later by inflationary pressures from rising fuel prices and tariffs.
It's worth noting that not every Ontario homeowner is seeing a 6% increase on renewal. For some, the average increase will be higher, and others may stay the same or even see a decrease. According to our data, in 2026 premiums declined in almost 18% of Ontario cities. Insurers price risk at a granular level based on things such as geography, property age, proximity to water, and emergency services in addition to claims history. Premiums will reflect where risk has increased but also where it has decreased, whether through infrastructure upgrades, increased access to emergency services, or lower historical claim frequency. What's driving the provincial average upward is a concentration of worsening risk in specific geographies and peril categories.
System backup and wind and hail damage drive premiums higher
Sewers overwhelmed and backing up during storms, known as system backup, and wind and hail are two of the most frequent and expensive perils, or risks, facing Ontario homeowners. As anyone who has dealt with a flooded basement or torn up roof can tell you, damage from these severe weather-related impacts can easily cost tens of thousands of dollars to repair.
Ontario is not an outlier. While other provinces may experience more wildfire risk than wind and hail, or more flood risk than system backup, overall premium increases are a country-wide trend reflecting years of inflationary pressures, increasing instances of severe weather and wildfires, and aging infrastructure and lack of adaptation planning.
So, what should homeowners do to lower insurance costs?
While there are steps homeowners can take to mitigate risk on individual properties, other causes of rising insurance premiums are beyond their control and require what the Insurance Bureau of Canada terms a “whole-of-society” approach.
Updating sewer and storm water infrastructure is key. The good news is that many projects are already underway in cities and towns throughout the province. This is encouraging, and this continued effort is what is needed to close the gap between Ontario’s aging infrastructure and the large volumes of rain that we now experience.
Homeowners can also meaningfully reduce their own risk through adding resiliency measures such as backwater valves, sump pumps with battery backup, fire-resistant siding, or wind-resistant roofing. These aren’t glamorous home upgrades but can effectively mitigate risk. Many municipalities in Ontario are encouraging adaptation through rebates, and several insurers offer premium discounts for installation. In addition to physically protecting the property, homeowners need to thoroughly understand their policies. Being aware of your deductibles, coverage limits, and what is and is not included for specific perils can help avoid unexpected and expensive out of pocket expenses in the event of a claim.
Insurers must proactively help homeowners understand what their options are so they can confidently make the best decisions for themselves and their homes. Whether first-time homebuyers, those looking to move, or homeowners shopping for new policies, everyone deserves to know what perils are driving the cost of home insurance premiums in specific areas, what the risk profile looks like for both neighbourhoods and individual addresses, and what they can do about it. We hope that our report and Home Insuramap tool are steps towards this goal.
How to optimize your coverage
Despite the various factors that increase home insurance premiums, homeowners still retain a measure of control. Your policy is what will ultimately dictate how much you pay for your insurance.
This means understanding exactly what is and isn’t covered by that policy. With weather-related perils being the biggest factor, here is the coverage you should expect from your standard policy across all the major perils:
- Wind/Hail: Included in a standard home policy.
- Crime (theft): Included in a standard home policy. However, certain valuable items often have set coverage limits (known as Special Limits). These items include jewellery, watches, luxury handbags or purses, furs and collectibles such as stamps, coins or sports cards. If you have such items, you might need to expand your coverage.
- Flood: System backup: Optional coverage that needs to be added separately.
- Flood: Exterior sources: Optional coverage that needs to be added separately.
- Wildfire: Included in a standard home policy as part of an overarching fire coverage.
The other control you have as a homeowner is to reduce the amount of damage various perils can cause to your home.
“Mitigating measures like clearing debris, cleaning eavestroughs, installing sump pumps, and backwater valves reduce the likelihood of a claim in the first place,” says Ivans. “Many insurers offer discounts for some of these upgrades, so they can pay off both in avoided losses and reduced premiums.”
Conversely, when it comes to replacement cost, you want to keep it accurate, especially after renovations, to make sure you are not underinsured in the event of a claim.
“For homeowners in high-risk areas, the smartest move is both, make sure your coverage reflects your home's actual value, and reduce your exposure to the perils most likely to affect you,” says Ivans. “A broker can help identify which upgrades your insurer recognizes and where your coverage may have gaps.”
Complete ranking of home insurance rates by Ontario city
See full table
Rank | City | 2026 premium | 2025 premium | YoY% change | % vs. ON avg. |
|---|---|---|---|---|---|
1 | $1,709 | $1,716 | -0.4% | -23.5% | |
2 | Concord | $1,769 | $1,841 | -3.9% | -20.9% |
3 | Woodbridge | $1,788 | $1,812 | -1.3% | -20.0% |
4 | $1,808 | $1,696 | 6.6% | -19.1% | |
5 | $1,810 | $1,885 | -4.0% | -19.0% | |
6 | Maple | $1,823 | $1,838 | -0.8% | -18.4% |
7 | Stratford | $1,824 | $1,844 | -1.1% | -18.4% |
8 | Waterdown | $1,842 | $1,984 | -7.2% | -17.6% |
9 | $1,851 | $1,952 | -5.2% | -17.2% | |
9 | $1,851 | $1,820 | 1.7% | -17.2% | |
11 | New Hamburg | $1,866 | $1,862 | 0.2% | -16.5% |
12 | $1,873 | $1,841 | 1.7% | -16.2% | |
13 | $1,881 | $1,856 | 1.3% | -15.8% | |
14 | $1,887 | $1,781 | 6.0% | -15.6% | |
15 | $1,910 | $2,010 | -5.0% | -14.5% | |
16 | Courtice | $1,926 | $1,775 | 8.5% | -13.8% |
17 | $1,958 | $1,781 | 9.9% | -12.4% | |
18 | Bradford West Gwillimbury | $1,965 | $2,025 | -3.0% | -12.1% |
19 | Acton | $1,970 | $1,946 | 1.2% | -11.9% |
20 | $1,974 | $1,721 | 14.7% | -11.7% | |
21 | Elmira | $1,983 | $1,932 | 2.6% | -11.3% |
22 | $1,999 | $1,718 | 16.4% | -10.6% | |
23 | $2,019 | $1,802 | 12.0% | -9.7% | |
24 | Kanata | $2,025 | $1,935 | 4.7% | -9.4% |
24 | King City | $2,025 | $2,022 | 0.1% | -9.4% |
26 | Cobourg | $2,037 | $1,554 | 31.1% | -8.9% |
27 | Kingston | $2,040 | $1,972 | 3.4% | -8.7% |
28 | Uxbridge | $2,042 | $1,888 | 8.2% | -8.6% |
29 | $2,044 | $1,860 | 9.9% | -8.5% | |
30 | Fergus | $2,045 | $1,732 | 18.1% | -8.5% |
30 | Midland | $2,045 | $2,163 | -5.5% | -8.5% |
30 | Mount Albert | $2,045 | $1,943 | 5.2% | -8.5% |
33 | Nepean | $2,062 | $1,967 | 4.8% | -7.7% |
34 | $2,063 | $2,115 | -2.5% | -7.7% | |
35 | $2,064 | $1,953 | 5.7% | -7.7% | |
36 | Ingersoll | $2,081 | $1,958 | 6.3% | -6.9% |
37 | Thornhill | $2,082 | $2,153 | -3.3% | -6.8% |
38 | Brant | $2,088 | $1,951 | 7.0% | -6.6% |
39 | Russell | $2,091 | $2,013 | 3.9% | -6.4% |
40 | $2,095 | $2,104 | -0.4% | -6.3% | |
41 | $2,096 | $1,888 | 11.0% | -6.2% | |
42 | Orangeville | $2,110 | $1,966 | 7.3% | -5.6% |
43 | Pelham | $2,114 | $2,145 | -1.4% | -5.4% |
44 | $2,121 | $1,939 | 9.4% | -5.1% | |
44 | $2,121 | $2,005 | 5.8% | -5.1% | |
46 | Bolton | $2,128 | $2,248 | -5.3% | -4.8% |
47 | Tillsonburg | $2,132 | $1,962 | 8.7% | -4.6% |
48 | Perth | $2,137 | $2,086 | 2.4% | -4.4% |
49 | $2,140 | $1,919 | 11.5% | -4.3% | |
50 | $2,142 | $1,903 | 12.6% | -4.2% | |
51 | $2,155 | $2,133 | 1.0% | -3.6% | |
51 | Port Perry | $2,155 | $2,219 | -2.9% | -3.6% |
53 | Amherstview | $2,160 | $1,952 | 10.7% | -3.4% |
54 | $2,161 | $2,064 | 4.7% | -3.3% | |
55 | $2,163 | $2,100 | 3.0% | -3.2% | |
55 | Penetanguishene | $2,163 | $2,140 | 1.1% | -3.2% |
57 | $2,164 | $2,078 | 4.1% | -3.2% | |
58 | New Tecumseth | $2,168 | $2,004 | 8.2% | -3.0% |
59 | Gananoque | $2,174 | $2,098 | 3.6% | -2.7% |
60 | Sunderland | $2,181 | $2,081 | 4.8% | -2.4% |
61 | $2,184 | $1,976 | 10.5% | -2.3% | |
62 | Winchester | $2,186 | $2,167 | 0.9% | -2.2% |
63 | Stirling | $2,191 | $2,145 | 2.1% | -2.0% |
64 | Meaford | $2,194 | $2,168 | 1.2% | -1.8% |
65 | North York | $2,200 | $2,151 | 2.3% | -1.6% |
65 | Quinte West | $2,200 | $2,206 | -0.3% | -1.6% |
67 | Goderich | $2,201 | $2,217 | -0.7% | -1.5% |
68 | Prescott | $2,203 | $2,107 | 4.6% | -1.4% |
69 | Bowmanville | $2,204 | $1,807 | 22.0% | -1.4% |
70 | Stayner | $2,206 | $2,226 | -0.9% | -1.3% |
71 | Mitchell | $2,208 | $2,310 | -4.4% | -1.2% |
72 | Delhi | $2,214 | $1,972 | 12.3% | -0.9% |
73 | Port Hope | $2,215 | $1,941 | 14.1% | -0.9% |
74 | Thornbury | $2,216 | $2,153 | 2.9% | -0.9% |
75 | $2,220 | $1,900 | 16.8% | -0.7% | |
76 | Elizabethtown | $2,223 | $2,256 | -1.5% | -0.5% |
77 | Kincardine | $2,225 | $2,285 | -2.6% | -0.4% |
78 | Grimsby | $2,233 | $2,159 | 3.4% | -0.1% |
79 | Napanee | $2,234 | $2,146 | 4.1% | 0.0% |
80 | Windham Centre | $2,245 | $2,094 | 7.2% | 0.4% |
81 | Harriston | $2,251 | $2,136 | 5.4% | 0.7% |
82 | Smithville | $2,254 | $2,149 | 4.9% | 0.9% |
83 | Parry Sound | $2,255 | $2,303 | -2.1% | 0.9% |
83 | Wasaga Beach | $2,255 | $2,310 | -2.4% | 0.9% |
85 | East York | $2,258 | $2,368 | -4.6% | 1.0% |
85 | Hanover | $2,258 | $2,054 | 9.9% | 1.0% |
87 | Brockville | $2,260 | $2,267 | -0.3% | 1.1% |
88 | $2,261 | $1,991 | 13.6% | 1.2% | |
88 | Fort Erie | $2,261 | $2,326 | -2.8% | 1.2% |
88 | Saint Marys | $2,261 | $2,151 | 5.1% | 1.2% |
91 | Lucan | $2,264 | $2,092 | 8.2% | 1.3% |
92 | Collingwood | $2,268 | $2,227 | 1.8% | 1.5% |
93 | Woodstock | $2,275 | $2,064 | 10.2% | 1.8% |
94 | Owen Sound | $2,276 | $2,028 | 12.2% | 1.8% |
95 | Welland | $2,277 | $2,162 | 5.3% | 1.9% |
96 | Phelpston | $2,282 | $2,334 | -2.2% | 2.1% |
97 | Branchton | $2,284 | $1,911 | 19.5% | 2.2% |
98 | $2,287 | $2,168 | 5.5% | 2.3% | |
99 | $2,290 | $2,200 | 4.1% | 2.5% | |
100 | $2,296 | $2,192 | 4.7% | 2.7% | |
101 | Carleton Place | $2,300 | $2,019 | 13.9% | 2.9% |
102 | Brantford | $2,301 | $2,159 | 6.6% | 3.0% |
103 | Innisfil | $2,303 | $2,150 | 7.1% | 3.0% |
104 | Arnprior | $2,305 | $2,228 | 3.5% | 3.1% |
105 | Kleinburg | $2,307 | $2,303 | 0.2% | 3.2% |
106 | Salford | $2,311 | $2,153 | 7.3% | 3.4% |
107 | Clarence-Rockland | $2,327 | $2,200 | 5.8% | 4.1% |
107 | Pembroke | $2,327 | $2,166 | 7.4% | 4.1% |
109 | Arden | $2,333 | $2,354 | -0.9% | 4.4% |
110 | Cornwall | $2,334 | $2,306 | 1.2% | 4.4% |
111 | Aylmer | $2,342 | $2,341 | 0.0% | 4.8% |
112 | Smiths Falls | $2,344 | $2,287 | 2.5% | 4.9% |
113 | Belleville | $2,354 | $2,105 | 11.8% | 5.3% |
113 | Newcastle | $2,354 | $1,905 | 23.6% | 5.3% |
115 | Flesherton | $2,369 | $2,450 | -3.3% | 6.0% |
116 | Simcoe | $2,372 | $2,017 | 17.6% | 6.1% |
117 | Hagersville | $2,391 | $2,284 | 4.7% | 7.0% |
118 | Coldwater | $2,392 | $2,268 | 5.5% | 7.0% |
119 | Listowel | $2,403 | $2,140 | 12.3% | 7.5% |
120 | Port Colborne | $2,419 | $2,150 | 12.5% | 8.2% |
121 | Kawartha Lakes | $2,433 | $2,196 | 10.8% | 8.9% |
122 | Dresden | $2,434 | $2,494 | -2.4% | 8.9% |
123 | Petawawa | $2,437 | $2,092 | 16.5% | 9.0% |
123 | Shelburne | $2,437 | $2,144 | 13.7% | 9.0% |
125 | Milbrook | $2,439 | $2,133 | 14.3% | 9.1% |
126 | Lakefield | $2,443 | $2,260 | 8.1% | 9.3% |
126 | Vankleek Hill | $2,443 | $2,310 | 5.8% | 9.3% |
128 | Orono | $2,451 | $2,064 | 18.8% | 9.7% |
129 | Wallaceburg | $2,458 | $2,204 | 11.5% | 10.0% |
130 | Thorold | $2,462 | $2,196 | 12.1% | 10.2% |
131 | St. Thomas | $2,469 | $2,176 | 13.5% | 10.5% |
132 | Bracebridge | $2,473 | $2,330 | 6.1% | 10.6% |
132 | Strathroy | $2,473 | $2,178 | 13.5% | 10.6% |
134 | Gravenhurst | $2,488 | $2,435 | 2.2% | 11.3% |
135 | Beachburg | $2,489 | $2,229 | 11.7% | 11.4% |
136 | Port Stanley | $2,491 | $2,283 | 9.1% | 11.5% |
137 | Huntsville | $2,492 | $2,369 | 5.2% | 11.5% |
138 | $2,493 | $2,455 | 1.5% | 11.5% | |
139 | Renfrew | $2,504 | $2,525 | -0.8% | 12.0% |
140 | Sundridge | $2,515 | $2,226 | 13.0% | 12.5% |
141 | Mckellar | $2,520 | $2,477 | 1.7% | 12.8% |
142 | Bobcaygeon | $2,540 | $2,284 | 11.2% | 13.6% |
143 | Springwater | $2,546 | $2,313 | 10.1% | 13.9% |
144 | North Bay | $2,547 | $2,419 | 5.3% | 14.0% |
145 | Orillia | $2,551 | $2,333 | 9.3% | 14.1% |
146 | Chatham | $2,575 | $2,370 | 8.6% | 15.2% |
147 | Ingolf | $2,593 | $2,618 | -1.0% | 16.0% |
148 | $2,615 | $2,311 | 13.2% | 17.0% | |
149 | Dorchester | $2,618 | $2,463 | 6.3% | 17.1% |
150 | Val Caron | $2,623 | $2,313 | 13.4% | 17.4% |
151 | Utterson | $2,638 | $2,446 | 7.8% | 18.0% |
152 | Espanola | $2,652 | $2,567 | 3.3% | 18.7% |
153 | Verner | $2,671 | $2,444 | 9.3% | 19.5% |
154 | Essex | $2,682 | $2,598 | 3.2% | 20.0% |
155 | Kemptville | $2,683 | $2,422 | 10.8% | 20.0% |
156 | Kirkland Lake | $2,689 | $2,611 | 3.0% | 20.3% |
157 | Lambton County | $2,694 | $2,203 | 22.3% | 20.5% |
158 | Lively | $2,700 | $2,443 | 10.5% | 20.8% |
159 | Torrance | $2,715 | $2,511 | 8.1% | 21.5% |
160 | Sault Ste. Marie | $2,722 | $2,600 | 4.7% | 21.8% |
161 | Caledonia | $2,726 | $2,487 | 9.6% | 22.0% |
161 | Hawkesbury | $2,726 | $2,076 | 31.3% | 22.0% |
163 | James | $2,729 | $2,615 | 4.4% | 22.1% |
164 | Sturgeon Falls | $2,732 | $2,590 | 5.5% | 22.2% |
165 | Leamington | $2,747 | $2,424 | 13.3% | 22.9% |
166 | Amherstburg | $2,750 | $2,493 | 10.3% | 23.0% |
167 | Kilworthy | $2,759 | $2,481 | 11.2% | 23.4% |
167 | Kingsville | $2,759 | $2,385 | 15.7% | 23.4% |
169 | Sioux Lookout | $2,761 | $2,759 | 0.1% | 23.5% |
170 | Elliot Lake | $2,779 | $2,490 | 11.6% | 24.3% |
171 | Little Current | $2,799 | $2,686 | 4.2% | 25.2% |
172 | $2,847 | $2,559 | 11.3% | 27.4% | |
173 | Wawa | $2,866 | $2,581 | 11.0% | 28.2% |
174 | Hanmer | $2,892 | $2,522 | 14.7% | 29.4% |
175 | Red Lake | $2,898 | $2,873 | 0.9% | 29.7% |
176 | Neebing | $2,931 | $2,868 | 2.2% | 31.1% |
177 | Dryden | $2,939 | $2,565 | 14.6% | 31.5% |
178 | Sudbury | $2,963 | $2,605 | 13.7% | 32.6% |
179 | Kenora | $2,994 | $2,826 | 5.9% | 34.0% |
180 | Mississagi River 8 | $2,997 | $2,572 | 16.5% | 34.1% |
181 | Timmins | $3,016 | $2,683 | 12.4% | 34.9% |
182 | Garson | $3,038 | $2,675 | 13.6% | 35.9% |
183 | Iroquois Falls | $3,085 | $2,744 | 12.4% | 38.0% |
183 | Kapuskasing | $3,085 | $2,783 | 10.9% | 38.0% |
185 | Beardmore | $3,104 | $2,708 | 14.6% | 38.9% |
186 | Chelmsford | $3,109 | $2,795 | 11.2% | 39.1% |
187 | Emo | $3,111 | $2,872 | 8.3% | 39.2% |
188 | Minaki | $3,216 | $2,967 | 8.4% | 43.9% |
189 | South Porcupine | $3,262 | $2,871 | 13.6% | 46.0% |
190 | Fort Frances | $3,287 | $2,998 | 9.6% | 47.1% |
191 | Cochrane | $3,322 | $2,855 | 16.4% | 48.6% |
*About Home Insuramap
Rates.ca’s Home Insuramap is an interactive online map that displays average home insurance premiums and risk levels in cities and towns across Ontario. Premiums and risk levels are ordered according to Forward Sortation Areas (FSAs) - the first three digits of a postal code. Estimated premiums are based on Rates.ca’s proprietary quoter data as of May, 2026. Risk levels are based on proprietary data provided by a leading global insurance data, analytics, and technology provider.
Estimated premiums are based on the average of the lowest three quoted premiums, with maximum available coverage for water protection using a profile of a 40-year-old homeowner, continuously insured for at least 10 years, who lives in a 2,500 sq ft detached house built 40 years ago, with brick veneer, wood frame construction, natural gas heat, a 10-year-old roof, and home replacement costs of $500,000.
Year-over-year percentage changes are calculated based on our 2025 estimated premiums adjusted to align with quotes from a similar set of providers across our 2026 broker pool. City average premiums are calculated using FSA premiums within each city, weighted using the number of actual quotes from Rates.ca’s websites in Q1 2026.
The Ontario average was taken using the average premium for each city weighted by the number of quotes in each city from Rates.ca’s websites in the first three months of 2026. Ontario’s average premium for 2025 was similarly adjusted to align with quotes from a comparative list of providers used for 2026 estimates.
For media inquiries, please contact:
Laura Fitch
Director of Editorial and PR
Rates.ca
Latest home insurance articles:
As the real estate market fluctuates, doing minor, strategic renovations may help improve your home equity and offset falling home values.

A comprehensive home insurance policy can help you cover significant repair costs from a water-damaged basement.

How to reduce risk of your car getting caught in an underground parking garage flood and details on your insurance coverage options.
Consider short-term home insurance additional options before you rent out your home to FIFA World Cup 2026 soccer fans.

Spring landscaping can affect your insurance. Minor grading changes can send water toward foundations, raising flood risk.

A backwater valve is a gate mechanism added to your wastewater outflow pipe that prevents city sewage from flowing back into your home.