Choose an Insurance Quote

Northern Ontarians pay up to 80% more for home insurance than the rest of the province
Jump to:
- Top 10 most expensive cities for home insurance
- Why home insurance is so much more expensive in northern Ontario
- Top 10 least expensive cities for home insurance
Show more
- Severe weather is driving up home insurance costs
- Tenants in northern Ontario pay up to two-thirds more in insurance than Toronto renters
- Water coverage can make up for up to 10% of your home insurance cost
- Home insurance premiums likely to rise over the next several years: What this means for insurers and consumers
- Live in a high-risk region? Here’s what to do
- How to protect your home at the right price for you
- Complete ranking of home insurance rates by Ontario city
- *About Home Insuramap

Content Manager

VP of Insurance & Chief Underwriting Officer
Many communities in northern Ontario, particularly rural communities, pay 30% to 80% more for their home insurance than cities around southern Ontario, according to the latest Rates.ca Home Insuramap data.
As of 2025, the average annual home insurance premium for a 45-year-old homeowner living in a 2,500 square foot home* in Toronto is $1,523. However, if they were to magically transport their home 2,000 kilometres northwest to Red Lake, a town near Manitoba, they could see their annual premium balloon to around $2,873.
Depending on where this homeowner settles, the average cost of home insurance across Ontario is $1,565 — which indicates that residents in Red Lake and surrounding areas could pay up to 80% more for home insurance than their average Ontario counterparts.
Our Home Insuramap data comprises weighted averages based on real home insurance quotes pulled from nine different insurance providers, for 184 cities and towns across the province. Across the map, we found that cities located in northern Ontario pay substantially higher home insurance premiums than in Toronto and surrounding municipalities in southern Ontario.
This is true even in the face of the worsening floods that have ripped through the region in recent years — including, and especially, the floods in 2024, which cost $940 million in insured damages.
This report will delve into the reasons behind the pricing as well as provide a full breakdown of the least and most expensive cities for home insurance in Ontario.
Key trends:
- The top 10 areas with the most expensive home insurance in Ontario are located north of the GTA. Most are smaller communities like Red Lake, Sioux Lookout, James, Ingolf and Minaki. Timmins, which has a population of around 40,000, is the biggest city in the top 10.
- Based on our data, a homeowner living in Red Lake, a town with a population of just over 4,000, could pay triple the amount that residents are paying in Woodbridge, the city with the lowest premiums.
- Homeowners in high-risk areas don’t just pay more in insurance premiums: They also pay more if disaster strikes, as many insurance providers institute a payout cap for even covered damages from flooding.
- The bottom 10 cities with the least expensive insurance in Ontario are in the south of the province, mainly in and around the GTA. They include Woodbridge, Ajax, Markham, Milton, Guelph and Bowmanville.
- One reason for the insurance premium disparity is that residents in remote northern communities face intensifying climate threats, while living further away from essential fire services.
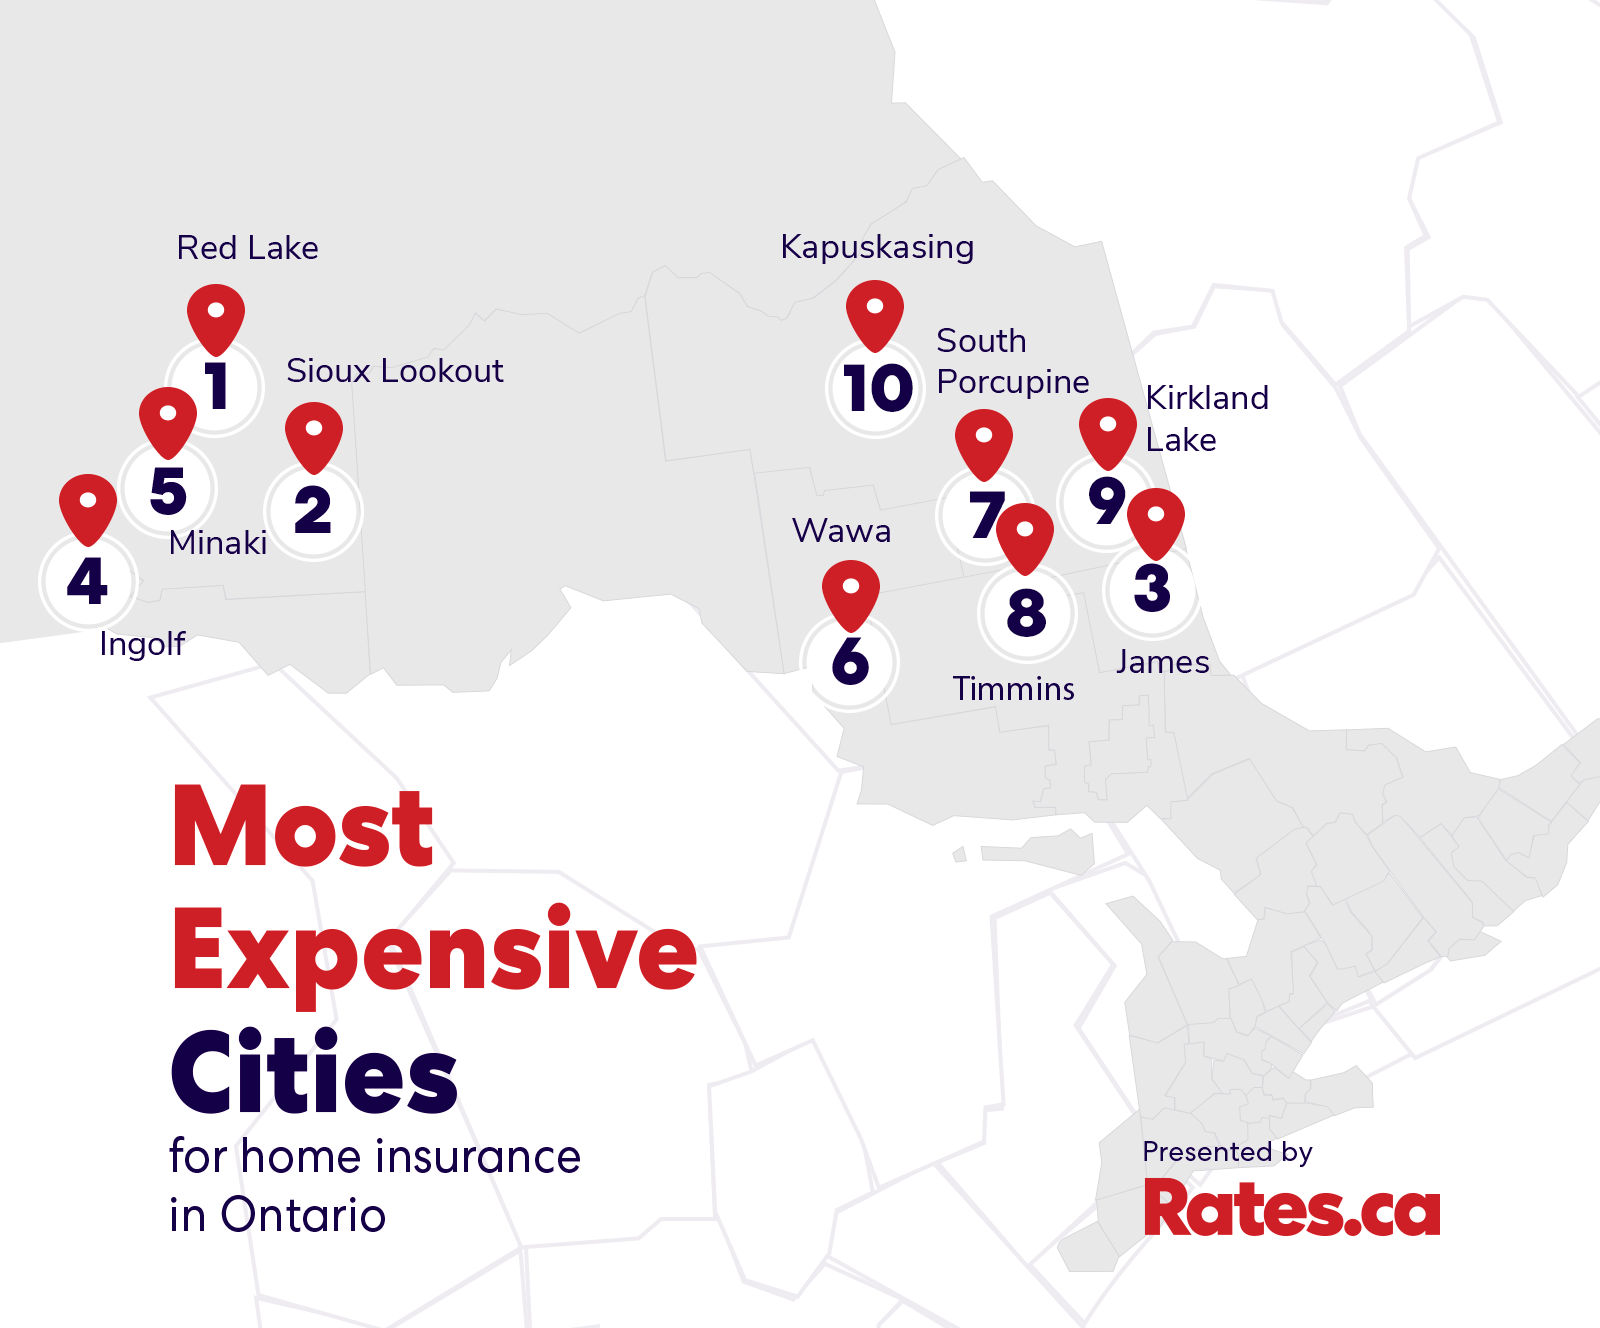
Rank | City | Estimated 2025 premium | % relative to Ontario average |
|---|---|---|---|
1 | Red Lake | $2,873 | 84% |
2 | Sioux Lookout | $2,759 | 76% |
3 | James | $2,599 | 66% |
4 | Ingolf | $2,552 | 63% |
5 | Minaki | $2,540 | 62% |
6 | Wawa | $2,494 | 59% |
7 | South Porcupine | $2,271 | 45% |
8 | Timmins | $2,201 | 41% |
9 | Kirkland Lake | $2,196 | 40% |
10 | Kapuskasing | $2,154 | 38% |
Why home insurance is so much more expensive in northern Ontario
Though property insurance rates in Toronto and southern Ontario are steadily increasing, home insurance premiums in those areas are still nowhere near as high as in northern Ontario.
This is mainly due to the harsher climate in those areas — the impact of which is made worse by poor or aging infrastructure and lack of access to essential amenities and services.
“Depending on their location, homes in northern Ontario could have a greater risk of wildfire, flooding and other extreme weather events,” explains Steve Cohen, Rates.ca’s VP of Insurance and Chief Underwriting Officer, adding that insurance companies often factor in proximity to fire services when pricing home insurance policies.
“Homes in rural and more remote areas tend to have an increased risk of major damage if there is a fire due to the lack of a nearby fire hydrant or fire station,” he says.
According to Cohen, homes in more remote areas can be more expensive to repair and rebuild, too. Fewer contractors in the area lead to higher costs for labour and transportation of materials, which can result in more expensive claims. Finally, there are windstorms, which, according to the latest studies, have become much more frequent in Ontario.
“Northern Ontario sees strong windstorms that cause roof, fence and siding damage,” says Stephanie-Lynn Gagne, an insurance broker with Oakville-based 705 Insurance. “These weather-related claims are common during seasonal changes and contribute to overall regional loss ratios.”
The latest data from Environment and Climate Change Canada indicates that climate change is likely to worsen in the near future. This would lead to hotter temperatures and more severe wildfires, along with more intense rainfalls, increasing the risk of urban and coastal floods.
According to Rates.ca insurance expert Daniel Ivans, if climate-related incidents continue to intensify, “premiums in high-risk areas are likely to rise at a faster rate than in urban centers like the GTA and other major cities.”
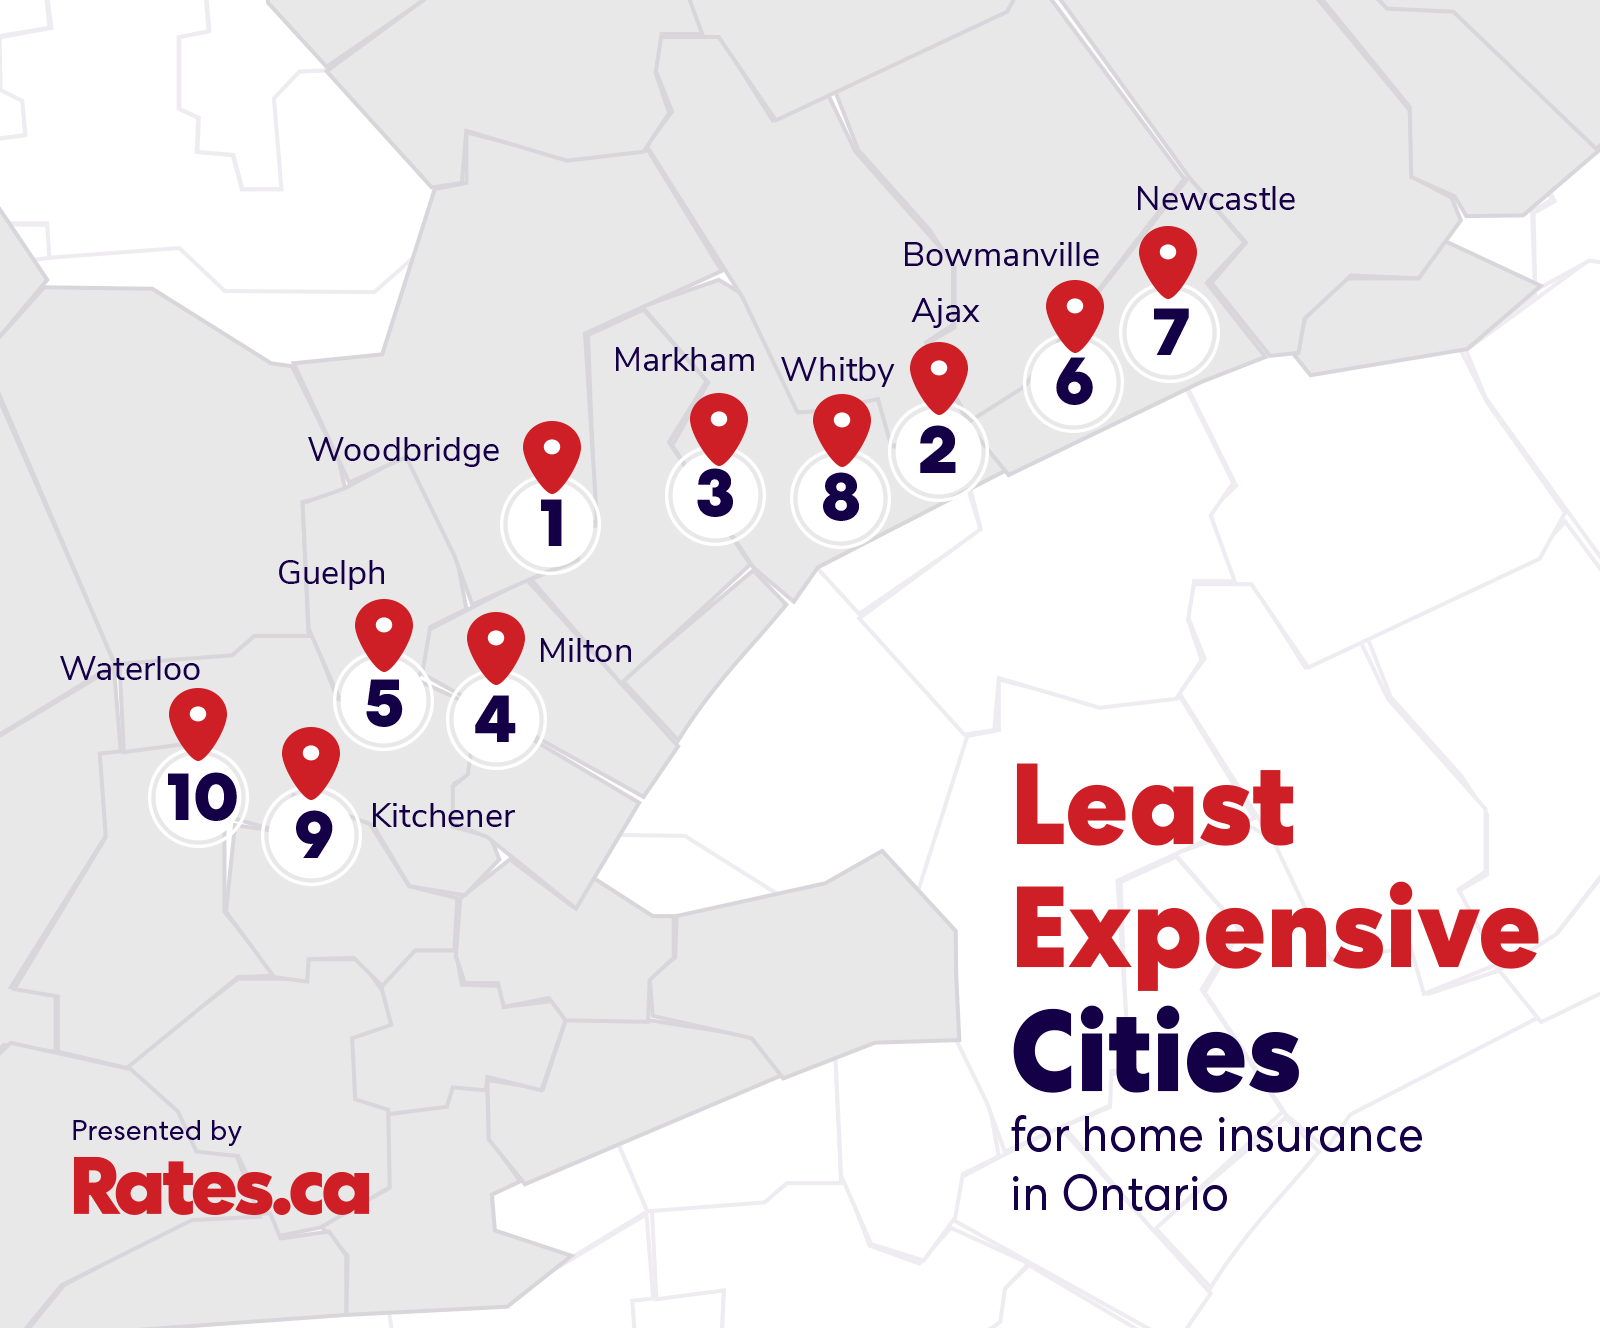
Rank | City | Estimated 2025 premium | % relative to Ontario average |
|---|---|---|---|
1 | Woodbridge | $1,032 | -34% |
2 | Ajax | $1,134 | -28% |
3 | Markham | $1,215 | -22% |
4 | Milton | $1,221 | -22% |
5 | Guelph | $1,242 | -21% |
6 | Bowmanville | $1,265 | -19% |
7 | Newcastle | $1,280 | -18% |
8 | Whitby | $1,280 | -18% |
9 | Kitchener | $1,326 | -15% |
10 | Waterloo | $1,334 | -15% |
Severe weather is driving up home insurance costs
Across the province, home insurance premiums are rapidly increasing.
According to Applied Rating Index, personal property lines in Ontario saw a 5.7% increase in premium rate change year over year in Q1 2025. This is slightly below the changes observed throughout 2024, which ranged from 13% to 9% between Q1 and Q4.
If the increased prevalence of severe weather events has been any indication, those rates are poised to go up. Severe weather has been costing the country more and more in insured damage each year.
According to the IBC, 2024 was the most expensive year on record, costing $8.55 billion in insured damage nationwide. The previous record was in 2016, at $6.2 billion.
Damage exceeding $2 billion — a rarity in previous decades — is now an almost yearly occurrence.
“Weather across Canada has become more extreme and unpredictable,” says Daniel Mirkovic, President and CEO of Square One. “This results in more frequent and severe damage to homes. And I would say it's pretty widespread across the entire province.”
Though wildfires are not as great a risk in southern Ontario, they are in areas in the northwest like Red Lake and Sioux Lookout, which both sit amid dense forests. According to Ontario’s fire map, this is where most of the wildfires in the province are located (as of June 2025), with several communities finding themselves under evacuation orders.
In 2023, for instance, wildfires burned over 18.5 million hectares of land in Canada, displacing 185,000 people, according to the Internal Displacement Monitoring Centre (IDMC) in Geneva.
And if it’s not fire that causes the brunt of the damage in Ontario, it’s flooding.
Gagne works with homeowners in the city of Timmins, which sees premiums that are 40% higher than the provincial average.
She cites sewer backup as “one of the most frequent and costly claims.”
“While Timmins’ sewer backups aren’t directly caused by a faulty city system, they are exacerbated by the combination of a sewer setup that gets overwhelmed during spring melt or heavy rain, aging infrastructure and overcapacity, and blockages caused by tree roots or improper waste disposal,” she says.
“Flooding from spring melt or rainfall runoff — especially near the Mattagami River — is also a frequent concern,” she adds. “These events often aren’t covered by default, so overland water endorsements are becoming increasingly essential.”
Tenants in northern Ontario pay up to two-thirds more in insurance than Toronto renters
By Jessica Wei
While renters and condo owners are largely insulated from major weather events, any perils that originate outdoors can sneak their way indoors — that’s true whether you’re 20 floors up in a glittering downtown tower or in a basement unit.
Houses have exterior walls, leaving them vulnerable to ghastly weather and falling branches; damage covered by traditional home insurance.
For that reason, pricing for condos and tenant policies differ from traditional property insurance policies. The overall building and shared common spaces are covered by commercial building insurance, which is purchased by the condo corporation and paid for by condo fees. For renters, those features are covered by the landlord’s property insurance.
Instead, individual tenant and condo insurance policies are more likely to be priced based on the value of your possessions.
But despite having less direct exposure to severe weather, the tenants in cities with overall most expensive premiums for tenant insurance match the ones for home insurance, and cities for condo insurance follow the same pattern. People who live further north, and further out in remote regions still tend to pay more to insure their units than those in southern Ontario.
According to the Home Insuramap, condo owners in Toronto pay around $646 for insurance — just a shade higher than the overall Ontario average of $631. Meanwhile, residents in Timmins pay $757 yearly, and those in the city of Kenora, near the Manitoba border, pay $708.
The average annual cost of tenant insurance is $289 in Ontario. A tenant in Toronto would typically pay around $300, but if they moved north to Red Lake, they’d be looking at an annual bill of just over $500 — or 67% more.
That’s because even between different residential policy types, many of the risks are the same: Namely, fire and floods.
Sewer backup is a particularly vital endorsement for condo owners and tenants — basement units tend to flood first (and worse!), and the more residents in a building sharing the same plumbing infrastructure are bound to see more backups.
On the fire front, proximity to firehalls and hydrants also factor into the equation, and so is the likelihood of having to be evacuated from your home.
Another easily overlooked piece of insurance for condo and tenant dwellers is Additional Living Expenses (ALE) or Mass Evacuation Coverage, which covers short-term accommodations in case of fire, or covered water damage, makes your home uninhabitable.
Like traditional homeowners, condo owners usually need to provide proof of insurance to secure a mortgage. Tenants, on the other hand, are only obligated to get insurance if it’s requested by landlords.
But even if it’s not, insurance is definitely not a cost worth cutting from your budget, because not having it could cost much, much more — and in more ways than one.
Learn more: Does renters' insurance covers damage to the landlord's property?
Water coverage can make up for up to 10% of your home insurance cost
Across Ontario, flood risk plays an outsized role in the cost of home insurance.
“Flooding plays a significant role in influencing premiums, especially in areas with higher water-related risks,” says Ivans. “Some data we're working on shows that in regions prone to flooding, water coverage costs make up 10% of the premiums.”
For example, he says, for a home insurance premium of $2,500, around $250 could go toward water coverage due to water-related risks like sewer backup and flooding. But in the event of a really bad flood, the homeowner may still have more to pay — for homes in riskier areas, like near lakes and rivers, some insurers limit the payout for water-related damages to $30,000.
“The trend we’re seeing shows the cost of water coverage rising while some providers continue capping coverage based on exposure,” he says.
So, even though your policy may have all available water protections, your coverage could still be capped at a certain amount.
“Premium variance comes down to the geographic location and insurer risk evaluation,” says Ivans. “For example, in Ontario, some insurers offer more comprehensive water coverage while others apply caps in certain high-risk areas.”
Mirkovic says that even if many of the headline weather disasters are concentrated in specific regions, all homeowners across the province end up footing the bill eventually.
“The whole principle of insurance is that losses of the few are paid by the many,” he says. “So, ultimately, insurance providers must increase premiums to ensure they're collecting enough money to pay for claims resulting from these natural catastrophes.”
Home insurance premiums likely to rise over the next years: What this means for insurers and consumers
By Steve Cohen, VP of Insurance and Chief Underwriting Officer
The future is not always certain, especially when it comes to disasters that can damage or destroy homes. But one thing we know with increasing certainty is that home insurance premium rates will continue to rise, likely in the high single digits, over the next several years.
While premium increases will vary by province and by geographic area, the Home Insuramap report shows that even the areas with the lowest estimated average premiums are still seeing premium increases overall — a trend that is likely to continue.
There are three main drivers of premium increases: climate change, repair and rebuilding costs, and reinsurance costs.
Perhaps the most immediate and visible concern is climate change. Severe weather events, such as the storms and flash flooding that swept through the GTA last summer, or the wildfires forcing thousands to evacuate in Manitoba and Saskatchewan, used to happen once every 20 to 50 years. They are now yearly occurrences.
The insured claims numbers are staggering. In 2024, insured losses from extreme weather events were more than $8.5 billion, according to the Insurance Bureau of Canada. To put that in perspective, the annual average of insured losses per year between 2001 and 2010 was $701 million. These exponential increases are reflected in rising premium costs.
While severe weather events are inflicting increasing amounts of damage to homes across the country, the cost to repair and rebuild after a disaster have also increased.
Inflation has pushed up the prices of everything from lumber and concrete to labor costs. Construction costs soared 51% in the first years of the pandemic and have continued to rise incrementally since. These price increases may be exacerbated by tariffs, especially on steel and lumber, over the course of the coming months.
These factors all play into rising claims costs that are straining insurers, which in turn raises risk levels for reinsurers, the global entities that provide insurance for insurance companies. The cost of reinsurance is also likely to rise as we experience severe weather patterns with increasing frequency and intensity globally. These increased costs will be passed down to consumers.
What does this mean for the insurance industry and for consumers? Insurers may deem certain small geographic areas uninsurable — for example, near a river that continually overflows, or areas that experience regular coastal surges — and decline to write policies in these places.
Or they may reduce coverage by capping coverage on certain risks, like on water coverage for homes in flood-prone areas, or introduce higher deductibles.
Expect to see increasing efforts towards education on loss prevention and loss prevention initiatives such as discounts for installing things like sump pumps and hail resistant shingles.
While the federal government has been looking at instituting a national flood insurance program that would provide lower-cost insurance options for homeowners that aren’t able to access adequate flood coverage or live in high-risk areas, it has yet to come to fruition.
For consumers, information is key. Understanding what the risks are for your home, what coverages are needed to mitigate that risk and the replacement value of your home and belongings will help in choosing a policy that best meets your needs.

Live in a high-risk region? Here’s what to do
Though most homes in Ontario are indeed eligible for most types of water coverage, many are not due to being built on known floodplains — about 5% to 10%, according to Mirkovic.
Ivans recommends that these homeowners consult closely with a broker.
“Even if 16 out of 17 providers in your area refuse coverage, brokers have the resources and partnerships to find the one option that aligns with your needs,” he says. “That's why brokers are invaluable — not just for finding coverage but for creating value through market leverage.”
If, however, water damage is inevitable, and your home is too high-risk for traditional coverage, Mirkovic suggests turning to government-funded Disaster Financial Assistance Arrangements (DFAA).
“It should really be a last resort,” he warns. “DFAA programs only offer very basic coverage, so it's not necessarily on a replacement cost basis. And they usually have maximums payable. So, depending on the province, you might only be eligible for an amount between $200,000 and $500,000 in recoveries from the program.”
Learn more: Is severe flooding making your home uninsurable?
How to protect your home at the right price for you
With the increasing number of claims related to severe weather and water damage, homeowners need more protections in place than ever.
Homeowners are advised to purchase a comprehensive policy, instead of a broad form or named perils policy.
“Comprehensive water coverage should ideally include sewer backup, overland water, groundwater and surface water coverage,” says Ivans. “Some insurers differentiate these coverages, so having a breakdown is important. Without this, homeowners in high-risk areas could face significant financial losses if an event falls outside their limited coverage.”
That said, it’s important to read the fine print or, better yet, have an insurance professional walk through the policy to you.
“Not all comprehensive policies are the same,” says Mirkovic. “Some comprehensive policies will exclude water damage altogether, and then you can add it back through an endorsement.”
Those who worry that their premiums are too high due to all the added protections — or their policy documents too opaque — may soon be able to have more say over their coverage, depending on their insurance provider.
Many companies are trending towards customizable solutions, says Ivans, allowing customers to adjust small details in their coverage, like how much value they want to place on a shed.
“This shift empowers consumers to take greater control over their premiums while aligning benefits with specific needs,” he says.
Ultimately, the level of coverage that homeowners actually need comes down to one simple question: What can you afford to pay out of pocket when disaster strikes?
“If you can’t afford $30 more a month for overland water coverage, you can’t afford to skip it,” says Ivans. “The cost of rebuilding or repairing after water damage can spiral into tens or even hundreds of thousands.”
Lastly, homeowners should regularly compare home insurance quotes online — it’s the easiest way to see what coverage is available in their area at the best price.
Complete ranking of home insurance rates by Ontario city
See full table
| Rank | City | Avg home insurance premium |
|---|---|---|
1 | Woodbridge | $1,032 |
2 | $1,134 | |
3 | Markham | $1,215 |
4 | $1,221 | |
5 | Guelph | $1,242 |
6 | Bowmanville | $1,265 |
7 | Newcastle | $1,280 |
8 | $1,280 | |
9 | Kitchener | $1,326 |
10 | Waterloo | $1,334 |
11 | Vaughan | $1,336 |
12 | Nepean | $1,336 |
13 | $1,338 | |
14 | Oakville | $1,343 |
15 | $1,350 | |
16 | $1,352 | |
17 | Kanata | $1,357 |
18 | Pickering | $1,361 |
19 | Courtice | $1,361 |
20 | North York | $1,364 |
21 | Uxbridge | $1,370 |
22 | $1,372 | |
23 | Richmond Hill | $1,375 |
24 | Caledon | $1,376 |
25 | Acton | $1,390 |
26 | $1,406 | |
27 | Whitchurch-Stouffville | $1,412 |
28 | Halton Hills | $1,414 |
29 | Perth | $1,426 |
30 | Wasaga Beach | $1,426 |
31 | $1,430 | |
32 | Amherstview | $1,435 |
33 | Peterborough | $1,447 |
34 | $1,448 | |
35 | New Hamburg | $1,449 |
36 | Kingston | $1,456 |
37 | Orillia | $1,459 |
38 | Kawartha Lakes | $1,464 |
39 | Lakefield | $1,467 |
40 | $1,470 | |
41 | Kleinburg | $1,478 |
42 | Quinte West | $1,478 |
43 | St. Catharines | $1,478 |
44 | East Gwillimbury | $1,482 |
45 | Orangeville | $1,493 |
46 | Thornbury | $1,496 |
47 | King City | $1,504 |
48 | Napanee | $1,507 |
49 | Caledon Village | $1,515 |
50 | Stratford | $1,518 |
51 | Fergus | $1,518 |
52 | Cobourg | $1,521 |
53 | $1,523 | |
54 | Kincardine | $1,534 |
55 | Tillsonburg | $1,539 |
56 | Kettleby | $1,540 |
57 | New Tecumseth | $1,543 |
58 | Bobcaygeon | $1,546 |
59 | Brockville | $1,549 |
60 | Waterdown | $1,559 |
61 | Gravenhurst | $1,563 |
62 | Port Perry | $1,567 |
63 | Bolton | $1,575 |
64 | St. Catharines | $1,577 |
65 | Petawawa | $1,577 |
66 | $1,582 | |
67 | Elizabethtown | $1,584 |
68 | Clarence-Rockland | $1,586 |
69 | Carleton Place | $1,587 |
70 | Innisfil | $1,594 |
71 | Aylmer | $1,595 |
72 | Stayner | $1,603 |
73 | Shelburne | $1,605 |
74 | $1,615 | |
75 | Gananoque | $1,618 |
76 | Emo | $1,622 |
77 | Vankleek Hill | $1,628 |
78 | Smiths Falls | $1,629 |
79 | Bradford West Gwillimbury | $1,631 |
80 | $1,633 | |
81 | Kemptville | $1,638 |
82 | Fort Erie | $1,640 |
83 | Georgina | $1,643 |
84 | Welland | $1,650 |
85 | Belleville | $1,653 |
86 | Grimsby | $1,654 |
87 | Pelham | $1,655 |
88 | Milbrook | $1,656 |
89 | Port Hope | $1,660 |
90 | Branchton | $1,667 |
91 | McKellar | $1,667 |
92 | Springwater | $1,669 |
93 | Greater Sudbury | $1,673 |
94 | Arden | $1,673 |
95 | Etobicoke | $1,675 |
96 | Sunderland | $1,677 |
97 | Pembroke | $1,682 |
98 | Penetanguishene | $1,686 |
99 | Meaford | $1,688 |
100 | Arnprior | $1,689 |
101 | Coldwater | $1,691 |
102 | Goderich | $1,691 |
103 | Russell | $1,691 |
104 | Ingersoll | $1,692 |
105 | Owen Sound | $1,696 |
106 | Fort Frances | $1,699 |
107 | Delhi | $1,701 |
108 | Simcoe | $1,703 |
109 | Torrance | $1,704 |
110 | Dorchester | $1,706 |
111 | Smithville | $1,707 |
112 | Sault Ste. Marie | $1,708 |
113 | Aurora | $1,710 |
114 | Windham Centre | $1,714 |
115 | North Bay | $1,714 |
116 | Hawkesbury | $1,715 |
117 | Sundridge | $1,716 |
118 | Bracebridge | $1,721 |
119 | Flesherton | $1,722 |
120 | Port Stanley | $1,727 |
121 | Brant | $1,731 |
122 | Phelpston | $1,732 |
123 | Espanola | $1,746 |
124 | Thorold | $1,746 |
125 | Port Colborne | $1,748 |
126 | Woodstock | $1,753 |
127 | Sarnia | $1,755 |
128 | Midland | $1,757 |
129 | Winchester | $1,761 |
130 | Parry Sound | $1,762 |
131 | Prescott | $1,763 |
132 | Hanover | $1,765 |
133 | $1,767 | |
134 | Elmira | $1,772 |
135 | Mississagi River 8 | $1,774 |
136 | $1,779 | |
137 | Lucan | $1,781 |
138 | $1,793 | |
139 | Orono | $1,796 |
140 | Chatham | $1,806 |
141 | Strathroy | $1,821 |
142 | Wallaceburg | $1,827 |
143 | Hagersville | $1,832 |
144 | St. Thomas | $1,842 |
145 | Amherstburg | $1,843 |
146 | Mitchell | $1,862 |
147 | Saint Marys | $1,871 |
148 | Lambton County | $1,877 |
149 | Collingwood | $1,905 |
150 | Stirling | $1,906 |
151 | Beachburg | $1,910 |
152 | Huntsville | $1,911 |
153 | Leamington | $1,920 |
154 | Cornwall | $1,923 |
155 | $1,924 | |
156 | Elliot Lake | $1,933 |
157 | Essex | $1,942 |
158 | Salford | $1,948 |
159 | Verner | $1,949 |
160 | Little Current | $1,956 |
161 | Point Edward | $1,960 |
162 | Iroquois Falls | $1,988 |
163 | Caledonia | $1,988 |
164 | Kingsville | $2,007 |
165 | Dresden | $2,044 |
166 | Cochrane | $2,064 |
167 | Neebing | $2,064 |
168 | Utterson | $2,069 |
169 | Dryden | $2,093 |
170 | Renfrew | $2,098 |
171 | Sturgeon Falls | $2,116 |
172 | Chelmsford | $2,122 |
173 | Kenora | $2,151 |
174 | Kilworthy | $2,151 |
175 | Kapuskasing | $2,154 |
176 | Kirkland Lake | $2,196 |
177 | Timmins | $2,201 |
178 | South Porcupine | $2,271 |
179 | Wawa | $2,494 |
180 | Minaki | $2,540 |
181 | Ingolf | $2,552 |
182 | James | $2,599 |
183 | Sioux Lookout | $2,759 |
184 | Red Lake | $2,873 |
*About Home Insuramap
Rates.ca’s Home Insuramap is an interactive online map, which allows Ontario residents to see how their home, condo or tenant insurance rates compare to other parts of their city or province.
The estimated premiums for each Forward Sortation Area (FSA) are based on the average of the lowest three quoted premiums, with maximum available coverage for water protection. The premiums were acquired using a profile of a 45-year-old homeowner, who has been insured for at least 10 years and lives in a 2,500 sq ft detached house, built 40 years ago, with brick veneer, wood frame construction, natural gas heat, a 10-year-old roof and replacement cost of $500,000.
The city averages were calculated using the FSA premiums from the Insuramap data for each city. However, instead of equal weighting for each FSA within the city, we looked at the number of actual quotes from Rates.ca’s websites in Q1 2025 and used those as weights.
The Ontario average was taken using the average premium for each city weighted by the number of quotes in each city from Rates.ca’s websites in Q1 2025.
For media inquiries, please contact:
Laura Fitch
Director of Editorial and PR
Rates.ca
Latest home insurance articles:
A comprehensive home insurance policy can help you cover significant repair costs from a water-damaged basement.

How to reduce risk of your car getting caught in an underground parking garage flood and details on your insurance coverage options.
Consider short-term home insurance additional options before you rent out your home to FIFA World Cup 2026 soccer fans.

Spring landscaping can affect your insurance. Minor grading changes can send water toward foundations, raising flood risk.

A backwater valve is a gate mechanism added to your wastewater outflow pipe that prevents city sewage from flowing back into your home.

As extreme weather intensifies, resilient Canadian homes sell for more: upgrades can add up to 5.6% to resale prices, yet many listings don’t mention them.